Blue World Employment Situation Report Analysis
Release Date: Usually the first Friday of each month
Release Site: www.bls.gov
Market Sensitivity: VERY HIGH
Management Value: VERY HIGH
Friday, May 04, 2012
Brain surgery is not rocket science to a brain surgeon©
Gotta love those “experts!” There was a big miss, bigger than usual, on the new jobs estimates put forth by the economist community. We should all be used to the surprises when the actual data comes out i.e. no longer a surprise.
If you’ve got a little time on your hands you can engage in one of our favorite amusements. That is, watching the markets as the jobs report is released. Pull up an intra-day futures chart and you’ll be able to spot the pre release jitters, the identification of the reduced unemployment rate, the realization that the number of new jobs forecast fell well below expectations and, finally, the beginning of the read of the detail. Oh, what the heck…hold on and I’ll grab a chart.
The report is released at 7:30a CDT. The chart starts at 7:28a CDT courtesy Ameritrade’s think-or-swim site. The down trend continued through time of publishing at about 1:15p CDT.
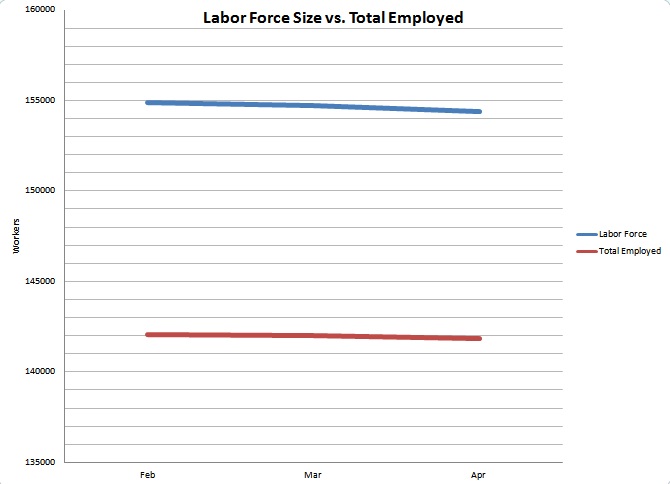
While the rate is down to 8.1% our quick review of articles out there proves that even the “experts” have caught on to simple math. Heck, there is an article in the Journal entitled Why Did the Unemployment Rate Drop? It actually does a good job explaining what we’ve been saying throughout this artificial decline in the unemployment rate. If you’re new to our blog you can see a full explanation of this in our post Why Does Blue World Keep Saying the Labor Market is not Improving? at http://owl.li/aHzYx The short explanation is that the number of employed people has been rising while the number of people reporting as members of the available labor force has been falling. As we keep saying, you can’t improve the labor market by making it smaller. This month there is an even more troubling trend developing. The graph below based on data from www.bls.gov, will show that the number of employed people actually fell for the first time in many months. Considering recent trends that should have kept the rate stable. The trouble is that the labor force shrank by a larger magnitude than the drop in the number of employed people! That’s a very disturbing trend we would not like to see continue.

Wage increases, plus changes in weekly hours and overtime are thoroughly underwhelming. In fact, a deep dive into the data showed a backwards move in some of these key categories for production and non-supervisory workers in manufacturing and construction. Even though inflation was down a couple of tenths, the earnings are still pathetically behind and that does not bode well for consumer spending.
There were notable up-ticks in areas where we don’t want to see up-ticks, such as the number of people at work part time for economic reasons, including slack work conditions and could only find part time work. Marginally attached to the work force and discouraged workers were up. That’s no surprise after seeing the overall labor force size decline on the first page. A little-known statistic that we mention occasionally is Job Leavers. These are workers who voluntarily leave their jobs before having another one lined up because they’re confident they can find other work when they want to. While always quite volatile month to month, the decrease in their totals for April was dramatic enough to mention today.
In other data we continue to see productivity fall while unit labor costs rise. Services declined in April, and that is disturbing at any time, but a spring decline is a departure from traditional norms as is the decrease in the labor force size. If monthly data like this doesn’t provide one with a reliable sense of the quarterly GDP report then nothing will. We continue to marvel at the shock expressed by so many authors and commentators at last week’s report. A full explanation can be found at http://owl.li/aHGSG in our post The Confusion Suffered by “Experts” II – GDP April, 2012
Encourage your legislators to read Blue World’s posts! Try as they might they cannot replace supply with legislation or demand with redistribution. The laws of economics are simple. Without demand there is no need for supply. If there is no need for supply then there is no need to keep the work force you had, much less hire new employees. If people aren’t working they don’t have buying power. Now we are full circle to no buying power leaves us without demand. Anyone who tries to make it more complicated than that may be any combination of ignorant, dishonest or, of course, an “expert!”
Investors, managers, entrepreneurs and business owners may do well to keep the defense on the field for the foreseeable future.
Thanks for reading and, please, stay tuned…
Release Site: www.bls.gov
Every effort is made to ensure accuracy of data transcription but accuracy cannot be guaranteed. The official release site should be cross referenced. The analysis represents the opinion of Blue World Asset Managers, Ltd. who does not warrant or guarantee predictions based on its analysis.
©Blue World Asset Managers, LTD Friday, May 04, 2012

