Blue World Preparing to Go Live!

Thank you for all the inquiries. It is true that the Blue World Jobs report Analysis and the Blue World Economic Index® report have not been published for the last couple of months. We are retooling to offer these reports as well as voluminous additional content on entrepreneurialism, business, economics, and investing in video format both live and recorded. We expect to have these up and running by June of this year!

We know you’re gonna love it!!

Blue World Jobs Report Analysis 12/07/2018

Blue World Employment Situation Report Analysis

Release Date: Usually on the first Friday of the month

Release Site: www.bls.gov

Market Impact: Usually Very High

Management Value: Critical

Brain Surgery is not Rocket Science to a Brain Surgeon©


Date: December 7, 2018 

Aren’t expectations incredible? We see the “experts” announcing the economy is losing steam because headline jobs numbers missed by 43K!! FUUGEDABOUDIT!

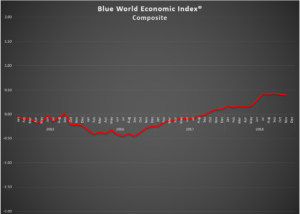
The economy is alive and well and that includes the jobs market. True, real estate is having some trouble but that has more to do with ill-advised Fed policy that may be slowed by this and some other data, but other than that the Blue World Economic Index® for November shows solid performance.

Headline total was 155K but the Private Sector added 161K. The Labor Force and Total Employed grew. Total Unemployed was down and Not in Labor Force was essentially flat. The diffusion Indexes are still very high with the Total Private Sector at 58 and the 76 Manufacturing Industries just shy of 64! There was a net down revision to the last two months but not enough to overcome the prior. Wage growth is still sluggish, but we expect it to catch up eventually, probably by Q2 2019.

Things are moving steady and strong. A little restraint from the Fed should feed Real Estate and don’t worry about trade wars. It may take a while to change learned behavior but they can’t hold out against the US for long.

Have a Merry Christmas and Happy New Year. We’ll wrap up 2018 on Friday, January 4th with the release of the December jobs numbers.

Thanks for reading, and please stay tuned…

Release Site: www.bls.gov

Every effort is made to ensure accuracy of data transcription but accuracy cannot be guaranteed.  The official release site should be cross referenced. The analysis represents the opinion of Blue World Asset Managers, LTD. who does not warrant or guarantee predictions based on its analysis.


©Blue World Asset Managers, LTD Friday, December 07, 2018

Blue World Economic Index® for November 2018

Brief Explanation 

Blue World Economic Index®

Scale: -2 to +2

Release Date:  Usually the Last or First Business Day of Each Month

Release Site: www.blueworldassetmanagers.com

Management Value: Critical

Date:12/03/2018


Analysis

The economy is maintaining a high level of performance but there were definitely some notable pullbacks in November 2018. Leading that list was Real Estate which continues to take a drubbing at the hands of the Fed and their here-to-fore ill-advised advancement of rate policy. This past meeting offered some hope for a hold for a while.

There was a bit of a mismatch in Wholesale Trade where the monthly inventory build outpaced sales but the year-on-year rate says more stocking is still needed. This would be less noticeable had it not been for the over sized contribution by Inventory to the latest GDP update.

There was a hiccup in the Richmond Fed report which showed declines in Employment and New Orders components and that will need to be monitored.

We obviously expect ebbs and flows in any economic conditions, but the shear strength of the current conditions makes any down blip noticeable. The fact is, however, the economy remains very strong and growing.

The Numbers

Six of eight major categories remain in positive territory as Real Estate slipped ever so fractionally back into red ink. Hopefully some Fed restraint will help. Inflation remains the anchor of the negative column, but it did make a material move positive in November. Consumer, Employment, General Measures, Manufacturing, Retail and Services all remain very comfortably positive with Services leading the way at a whopping .84!

Look for the Blue World Jobs Report out this Friday the 7th and Matt will break it down live on WBBM’s Noon Business Hour in Chicago at 12:09p Central, streaming, AM 780 and 105.9FM, and the Podcast will post later in the day.

Merry Christmas and Happy New Year!


Every effort is made to ensure accuracy of data transcription but accuracy cannot be guaranteed.  The official release sites should be cross referenced.  The index assignments represent the opinion of Blue World Asset Managers, Ltd. who does not warrant or guarantee predictions based on the index.

©Blue World Asset Managers, LTD Monday, December 03, 2018

Blue World Jobs Report Analysis – September 7, 2018

Blue World Employment Situation Report Analysis

Release Date: Usually on the first Friday of the month

Release Site: www.bls.gov

Market Impact: Usually Very High

Management Value: Critical

Date: September 7, 2018

Brain Surgery is not Rocket Science to a Brain Surgeon©


Revisions and wages command the attention from the August jobs report. The headline is 201k while the private sector added 204k as government got smaller again. This is a solid report, but it did cool from the unsustainable pace set by the last several months. The key areas of Labor Force size, Participation Rate, Total Employed and Not in Labor Force totals lost a little ground. That coupled with a net 50k in downward revisions to the prior two months shows a bit of a return to earth, at least for August, but this data in no way suggests any slowing in the economy at large.

The number of those at work part-time for economic reasons is way down again and those part-timers for non-economic reasons is up again. The Diffusion Indexes are still over 50 even with a drop off in manufacturing jobs, and the Private Sector totals are still averaging over 200k for the year in spite of the oversized downward revisions.

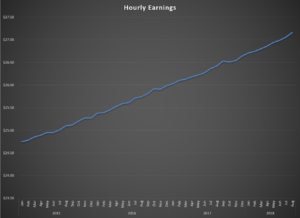
The big news, however, comes from wages. Last month on WBBM’s Noon Business Hour Matt was asked about wage pressure if we are indeed near full employment. He predicted it should start to show up soon, and here it is! At .4 and 2.9 percent month over month and year on year, respectively, these handily beat estimates, and we can already hear the hawks’ wings beating the air. It will be difficult for the Fed to keep their fingers off the volume, so we see a good chance of another hike at the next meeting.

The Blue World Economic Index® posted earlier this week and we’ll see you back here at the end of the month. Have a great September 2018.

Thanks for reading, and please stay tuned…

Release Site: www.bls.gov

Every effort is made to ensure accuracy of data transcription but accuracy cannot be guaranteed.  The official release site should be cross referenced. The analysis represents the opinion of Blue World Asset Managers, LTD. who does not warrant or guarantee predictions based on its analysis.

 ©Blue World Asset Managers, LTD Friday, September 07, 2018


Blue World Economic Index® Report for August 2018

Brief Explanation

Blue World Economic Index®

Scale: -2 to +2

Release Date:  Usually the Last or First Business Day of Each Month

Release Site: www.blueworldassetmanagers.com

Management Value: Critical

Date: September 4, 2018


Analysis

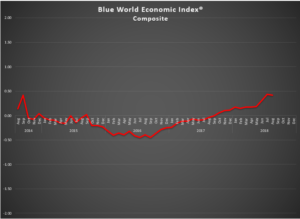
While the Blue World Economic Index® held its ground in August of 2018, there are some indications of turbulence in Real Estate. On the heels of some quarterly trend upgrades last month, this Major Category showed no change for August. That is a bit deceptive, and without some major positive moves in September, simply won’t hold up. This morning’s Construction Spending report does not offer much optimism.

Outside of that the economy remains solid and cautious as things like tariffs, trade deals, mid-term elections, investigations, SCOTUS hearings, and porn star pay-offs exert their material impacts.

The Numbers

The index held essentially steady at .42, which, while a tick below July, represents a decimal rounding.

Seven out of eight Major Categories remain in the black with only Inflation still swimming in red ink. Inflation had been limping along in “mixed” territory month in and month out until PPI FD and Farm Prices, which book-end the monthly calendar, each came in at levels weaker than their multi-month averages pulling that category fractionally further South. The other four reports from the Inflation category were in line with their trends. Consumer, General, Retail, and Services also moved fractionally lower.

The only real news-makers at all for August were Employment and Manufacturing, where Employment made the only “material” move at .12 to the good. Manufacturing advanced slightly by .04, but the news comes from the Fed/Non-Fed subgroups where in a very unusual and welcome departure from normal the anecdotal heavy Fed sub-group declined, while the hard data Non-Fed subgroup advanced!

The economy is doing great in a vacuum, but the external, non-economic threats to economic health from the second half of the list above are extraordinary. Survey data suggests the cautious tone of an otherwise booming market are based in concerns that the policies producing the high activity are at risk. If we could dispense with some of the noise we’d see an even more robust environment.

The Blue World Jobs Report Analysis will post on Friday morning. We hope to see you there!


Every effort is made to ensure accuracy of data transcription but accuracy cannot be guaranteed.  The official release sites should be cross referenced.  The index assignments represent the opinion of Blue World Asset Managers, Ltd. who does not warrant or guarantee predictions based on the index.

©Blue World Asset Managers, LTD Tuesday, September 04, 2018