Blue World Employment Situation Report Analysis
Release Date: Usually the first Friday of each month
Release Site: www.bls.gov
Market Sensitivity: VERY HIGH
Management Value: VERY HIGH
Friday, January 06, 2012
Brain surgery is not rocket science to a brain surgeon©
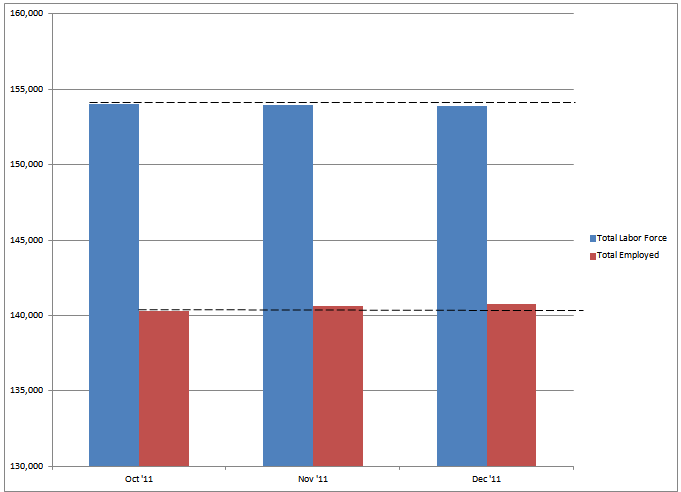
We’re afraid there is more hocus pocus in the jobs data this month. As was true last month the labor force continues to shrink while the number of employed people rises. That creates the appearance of an improving labor market but it simply isn’t the case. If that does not make sense please review our clarification post from last month at http://owl.li/8kHlp .
We are always amused at the markets graphic response to the announcement and subsequent movement as the detail is understood. At this time it appears the details are out as the S&P meanders between down and flat.
They’ve reported 200k new jobs and a rate that fell .2% to 8.5%. That fall is consistent with the phenomenon described above and graphed below. As you can see, the total work force continues to contract as the number of those employed rises yielding a lower unemployed percentage in spite of a stagnant labor market. (Source: www.bls.gov)
But, like we always say, the headlines are useless without the detail so let’s take a look.
The unemployed rate for those who hold a Bachelor’s degree or higher and are over 25 years old remained in a narrow and unacceptable range over 4% (average 4.35% for 2011). There is much ado being made about the drop in the number of unemployed for over 27 weeks. What we don’t see is a discussion of the rise in those unemployed for less than 5 weeks and that number is flirting with the December 2010 levels.
The length of the work week for manufacturing along with overtime hours and pay remains flat.
Even though the number of those unemployed for over 27 weeks appears to be down we were surprised to see the average duration of unemployment to have ticked up, slightly.
For some year-over-year analysis, from December 2010 to December 2011 the number of those holding multiple jobs has increased and those whose primary and secondary jobs are both part time also rose. Perhaps more disturbing is the finding that those spending varying amounts of time on their primary and secondary jobs also rose.
We don’t like negativity and we don’t view this and previous analyses as positive or negative. They simply are what they are. The data is the data. We appreciate the desire/need to put a positive spin on it for social, economic and political reasons but if you are in a position of responsibility for business or investment management the truth is an absolute necessity. We hope this helps.
Thanks for reading and, please, stay tuned…
Release Site: www.bls.gov
Every effort is made to ensure accuracy of data transcription but accuracy cannot be guaranteed. The official release site should be cross referenced. The analysis represents the opinion of Blue World Asset Managers, Ltd. who does not warrant or guarantee predictions based on its analysis.
©Blue World Asset Managers, LTD Friday, January 06, 2012

