Blue World Employment Situation Report Analysis
Release Date: Usually on the first Friday of the month
Release Site: www.bls.gov
Market Impact: Usually Very High
Management Value: Critical
Date: Friday, March 09, 2018
Brain Surgery is not Rocket Science to a Brain Surgeon©
BRACE YOUSELVES…
WE CAN’T FIND ANYTHING “WRONG” WITH IT!!!
And you know we try! So often is the case that the headlines are contradicted by the detail the deeper we push into the weeds. This works in both directions and for any report, not just jobs. This report has a couple of “weaker” spots but no “weak” ones. We’ll start with those.
Overall, Weekly Hours Worked and Wages were essentially up-less-than-expected to flat as was the number of Unemployed. That’s it.
The Participation Rate bridges the gap between “weak” and “strong” by straddling the line, in as much as 63% is still unacceptably low, but it moved .3% to the North in a single month. You may recall we were horrified the last time it moved that much from one report to the next. We called it virtually unprecedented, and it moved the wrong way. Not this time!
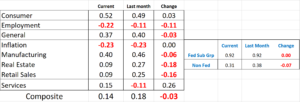
The headlines screamed 313k of which 287k came from the Private Sector. That, plus upward revisions to December 2017 and January 2018 of +54k, brings the 2018 monthly average to the mid-200’s. The Labor Force grew by an impressive and refreshing 806k. Total Employed grew by 785k, and the Not in Labor Force tally fell by a fabulous 653k. That’s huge. The Diffusion indexes for the Total Private Sector and Manufacturing are massive and flirting with 70. For reference, we saw 30s not so long ago.
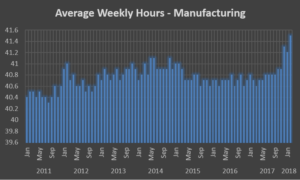
Now, let’s get back to hours and wages. There is concern from the “experts” out there this morning that there is still no sign of wage pressure. Au contraire! I guess they just don’t know their way around the deep weeds like we do… Review Table B-3 of the Report. Average Hourly Earnings for All Employees M/M and Y/Y were up .1% and 2.5%, respectively. Both were below most consensus estimates. BUT, Average Weekly Earnings were up 3.1% Y/Y so salaried employees seem to be on the move so Hourly will follow if this holds. Even more important, compensation in the Construction industry came in at Y/Y increases of 3.5% and 4% for Hourly and Weekly, respectively. In our relative world of the past ten years, those are pretty good numbers. The work week for all employees remained range-bound but Weekly Hours in Manufacturing jumped from 41.2 hours to 41.5 hours. That is the highest reading since before 2011 (Chart) and Overtime in Manufacturing hit 3.6 hours. That is only the second time since 2011.
Risks? First and foremost is still the Fed. We don’t want to see rate hikes in anticipation of inflation. We need to see some consistent evidence and inter-report confirmation lest we risk locking up the economic brakes. Second, this report may set unrealistic expectations. A reading of say, 230k in the Private Sector next month may not look so good compared to today’s outsized numbers. Also, beware of revisions. We see them be material time and time again. Today is a great example. Optimism, when supported by trending data, is OK when making strategic business decisions. Euphoria is just plain dangerous!
Matt will be on WBBM’s Noon Business Hour in Chicago at 12:09 CST to break it all down live. That’s AM780 and 105.9FM and the Podcast will post later in the day.
If you missed it, you can review the Blue World Economic Index® for February 2018. We’ll see you back here around the first of April for the next BWEI® Report and the jobs report for March is schedule for release on Friday, April 6th.
Have a great March and may your brackets prove un-bustable!!
Thanks for reading, and please stay tuned…
Release Site: www.bls.gov
Every effort is made to ensure accuracy of data transcription but accuracy cannot be guaranteed. The official release site should be cross referenced. The analysis represents the opinion of Blue World Asset Managers, LTD. who does not warrant or guarantee predictions based on its analysis.
©Blue World Asset Managers, LTD Friday, March 09, 2018