Material Update – Blue World Jobs Report Analysis – 5-8-2017

Blue World Employment Situation Report Analysis

Release Date: Usually on the first Friday of the month

Release Site: www.bls.gov

Market Impact: Usually Very High

Management Value: Critical

Date Monday, May 08, 2017

Brain Surgery is not Rocket Science to a Brain Surgeon©

Material Update

In the April release for March 2017 we observed that the numbers just weren’t lining up among the jobs related data sets. We predicted some revisions and they showed up today in what we considered to be material enough to append this morning’s release of the Blue World jobs analysis.

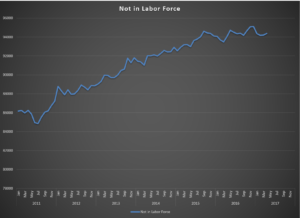
As our regular readers know, the unemployment rate as published has lost its value as an indicator of labor market health. The numbers deep in the weeds need to be reviewed to get a true sense of where we are. We are not saying the labor market is “strong” by any means but we are starting to see some movement in the right direction, especially in certain down-and-out sectors like Logging and Mining as well as the apparent flattening of the Not in Labor Force graph from this morning’s release. We also had the unique situation last month where the headline was a disaster but the detail was a bit better.

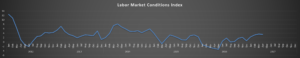
All that finally showed up today in the Fed’s Labor Market Conditions Index (Chart) which looks at similar data to Blue World to form a picture worthy of monetary policy consideration. The release was delayed at the source and we have to believe it’s because they had to check their numbers because there were up revisions to the entire year 2017 to date. This is more in line with what Blue World has been seeing and, certainly, a different picture than last month.

So, with that, consider yourself updated. May we manage May well! (Yes, we hear the well- deserved boos.)

Thanks for reading, and please stay tuned…

Release Site: www.bls.gov

Every effort is made to ensure accuracy of data transcription but accuracy cannot be guaranteed.  The official release site should be cross referenced. The analysis represents the opinion of Blue World Asset Managers, LTD. who does not warrant or guarantee predictions based on its analysis.


©Blue World Asset Managers, LTD Monday, May 08, 2017

Blue World Employment Situation Report Analysis

Release Date: Usually on the first Friday of the month

Release Site: www.bls.gov

Market Impact: Usually Very High

Management Value: Critical

Date Monday, May 08, 2017

 Brain Surgery is not Rocket Science to a Brain Surgeon©


Well, that’s a little better. The details are still weaker than we’d like to see, but last month’s train wreck does look like an outlier. While we thought there may be an upward revision to March, we saw the opposite as it moved from 98k to 79k. The Labor Market Conditions Index, as we expected, did show much stronger than the BLS headlines would have implied. So, what about April?

April looked much better at the top with the 211k. Slightly disappointing, however, is that the private sector remained below 200k at 194k. In spite of that and the mind-numbing March numbers, the Private Sector is already averaging 14k higher per month than 2016.

The Participation Rate is sub-63 with a very disappointing 162k returning to the Not in Labor Force group, BUT we may be able to start to hallucinate a flattening of that graph for the first time in many years. That’s the chart this month. Feel free to let us know if you see what we see. Total Employed and Total Unemployed both made solid moves in the right direction while the Total Private and Manufacturing diffusion indexes remain comfortably above 50. That is all wonderful to see.

Wages? Meh. The work week remains range-bound as does overtime in Manufacturing.

The Fed’s Labor Market Conditions Index won’t post until 10:00a Eastern, and we want to get this to press, so we will simply predict an improvement there as well. They do, after all, reject the “expert” analyses and read these things the way Blue World does…

Have a great month and we’ll see you here at the back end with the Blue World Economic Index® summary.

As always, thanks for reading, and please stay tuned…


Release Site: www.bls.gov


Every effort is made to ensure accuracy of data transcription but accuracy cannot be guaranteed.  The official release site should be cross referenced. The analysis represents the opinion of Blue World Asset Managers, LTD. who does not warrant or guarantee predictions based on its analysis.


©Blue World Asset Managers, LTD Sunday, May 07, 2017

Blue World Economic Index® for April 2017


Brief Explanation of the Index


Blue World Economic Index®

Scale: -2 to +2

Release Date:  Usually the Last or First Business Day of Each Month

Release Site: www.blueworldassetmanagers.com

Management Value: Critical

Release Site: www.blueworldassetmanagers.com

Date: Monday May 1, 2017


Brain Surgery is not Rocket Science to a Brain Surgeon©


The gulf between consumer and institutional optimism surveys, and the hard performance data continues to be the story in the Blue World Economic Index®. Consumer mood and anecdotal institutional survey data continue through the roof, although there was some pullback at the institutional level in April. Nevertheless, retail and consumer spending were bordering on abysmal for the month so the aforementioned gulf actually widened when the whole I’m-an-economics-geek world expected it to start showing signs of narrowing!

The composite index was essentially flat coming in at -.12 compared with -.11 in March. That flatness is on the back of a major surge and some trend upgrades very late in the month right up to and including Friday morning. It makes some sense to post the whole Major Category table this month in order to limit what could easily run into three pages of explanation, but we will hit the highlights and lowlights here in the text body. Let’s start with the weak, and work our way better.

Of the eight major categories, the far and away biggest losers were Services and Employment, both posting .17 drops. Yes, we said Employment, regardless of all the nonsense we hear about how great the labor market is. We still have WAY too many people in the Not in Labor Force camp to say employment is strong. Retail took a hit, and that was in large part due to a slowdown in auto sales.

On the upside, Consumer measures are on a rocket ride that just won’t slow down, and that even includes Sentiment which takes party affiliations into account. This is just bizarre when compared to consumer spending, which was the biggest hit to Friday morning’s GDP report.

As you can see above, the Fed subgroups did pull back a bit but are still strongly positive at .3, but the hard data from the non-Fed group breakout are decidedly negative and moving down.

Q2 will be fascinating to watch as this economy struggles to find a direction. In the meantime, look for the Blue World Jobs Report Analysis next Friday or Monday.

Have a great May and a happy spring!


Every effort is made to ensure accuracy of data transcription but accuracy cannot be guaranteed.  The official release sites should be cross referenced.  The index assignments represent the opinion of Blue World Asset Managers, Ltd. who does not warrant or guarantee predictions based on the index.
©Blue World Asset Managers, LTD Monday, May 1, 2017