Blue World Employment Situation Report Analysis
Release Date: Usually on the first Friday of the month
Release Site: www.bls.gov
Market Impact: Usually Very High
Management Value: Critical
Friday, April 01, 2016
Brain Surgery is not Rocket Science to a Brain Surgeon©

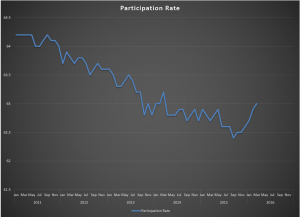
Mixed again but leaning cautionary for March of 2016. Let’s start with the positives. The Labor Force and Participation Rate increased, the Not in Labor Force total decreased and pay recovered from last month’s backtrack. We don’t need to keep explaining the phenomena that makes the Unemployment Rate irrelevant, but we can’t help but point out the 0.1 percent rise to 5% is actually an indication of some strength due to the upward trending Participation Rate.
On the downside the Work Week remained flat for the non-farm population but pulled back in both construction and manufacturing, whose diffusion index has lost 20 points in the first quarter falling to 37.3. That’s really bad. The real concern, however, is hiding behind the headline of 215k net jobs. Revisions to the first two months of the quarter so far netted a largely insignificant -1k. The problem is in the private vs. public sectors. March saw a net 20k in government hires, leaving the private sector picking up only 195k. The average for 2015 was net 222k hires per month in the private sector. Q1 of 2016 is sporting an average of only 195k.
This report typically issues on the first Friday of the month. They will often delay for a week when the first Friday also happens to be the first of the month but not this time. Not only is it the first of the month, but it is also quarter end. Respondents, especially businesses, have higher priority internal undertakings than the timely reply to surveys. That leads us to look for potentially larger revisions to March 2016 over the next couple of months as more complete data makes its way home.
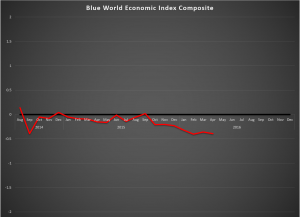
What about the Fed? There is ammunition here for the Doves and Hawks. You can spin this one for strength or weakness, hence our actionable management intelligence characterization of “mixed.” Ultimately there is not enough here for a rate hike, and watching the Fed’s Labor Market Conditions Index on Monday will be important, although we don’t expect any huge move in either direction. That said, we see the Fed holding pat. Apparently, so does Ms. Yellen following her dovish leanings yesterday. The Blue World Economic Index™ for March 2016 supports the doves.
Have a great month. Thanks for reading, and please stay tuned…
Release Site: www.bls.gov
Every effort is made to ensure accuracy of data transcription but accuracy cannot be guaranteed. The official release site should be cross referenced. The analysis represents the opinion of Blue World Asset Managers, LTD. who does not warrant or guarantee predictions based on its analysis.
©Blue World Asset Managers, LTD Friday, April 01, 2016


