
Blue World Employment Situation Report Analysis
Release Date: Usually the first Friday of each month
Release Site: www.bls.gov
Market Sensitivity: VERY HIGH
Friday, January 10, 2014
Brain surgery is not rocket science to a brain surgeon©
Happy New Year, everyone.
Hey, can you smell that? The jobs numbers are out. Not only do they stink, the headline stinks even worse! We would be remiss if we didn’t mention the claims made by our esteemed leaders that unemployment benefits create jobs. Yes, Pelosi, Obama and Durbin have all said it repeatedly. Based on the record number of those receiving jobless benefits there should be more jobs than available workers to fill them with an unemployment rate less than zero! Sadly, neither is true because…wait for it…unemployment benefits DO NOT create jobs.
The unemployment rate fell .3% to 6.7%! That’s good, right? SORRY. Ask yourself, does it make sense that 74,000 jobs could move the needle .3% when 203K the month before (now revised to 241k) could only move it .2%? We witnessed another huge exodus from the labor force in December, so we continue to see our painfully long trend of more people leaving the labor force than getting jobs. That gives us an increasingly artificial, distorted, misleading and frankly invalid unemployment rate.
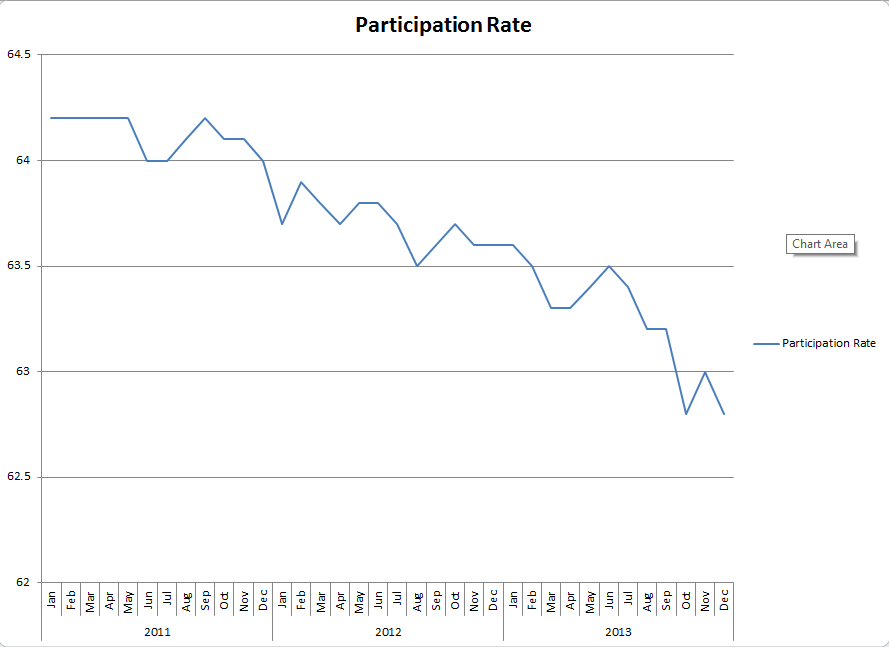
There was a decrease of 490K unemployed people, but that isn’t because they got jobs. It’s because they left the labor force as demonstrated by the half-a-million increase in the number of those not in the labor force and a participation rate that matched its HISTORICAL ALL TIME LOW of 62.8%. The number of those at work part-time due to slack work or couldn’t find full-time jobs, marginally attached workers and discouraged workers are all up by dishearteningly large numbers, leaving the more accurate unemployment rate just over 13%. The work week remains range bound and wages grew by a paltry 1.8% year-over-year. That is of concern when considering the Fed’s recent statements regarding anxiety over inflation.
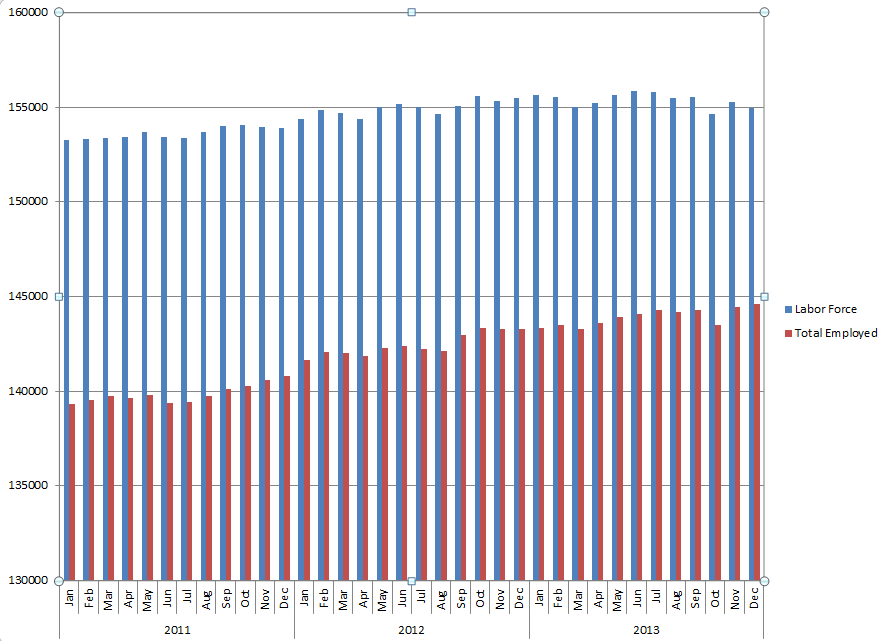
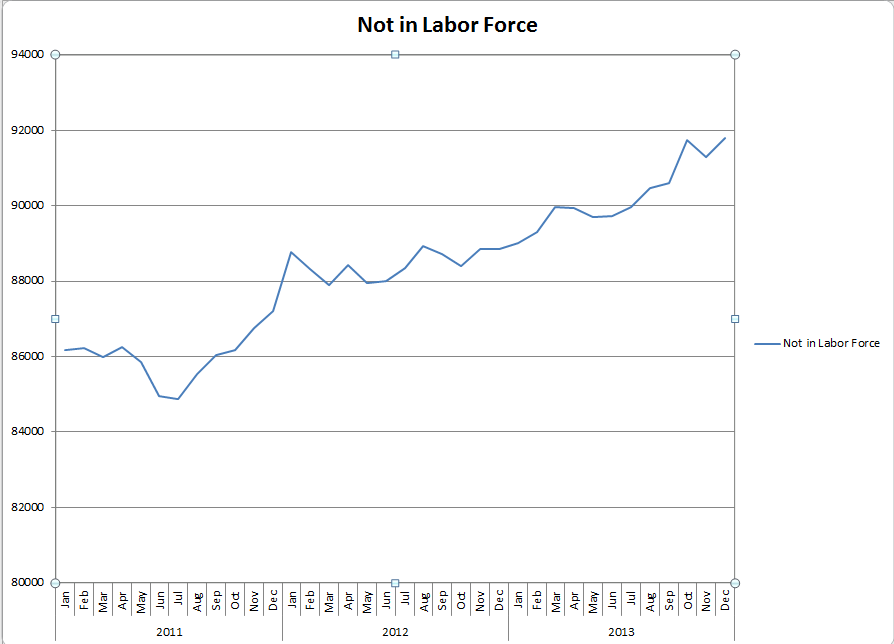
Below are a few striking graphs. The first graph gives us the complete picture of those employed relative to the total available work force for three complete years, 2011, ’12, and ’13. The second demonstrates the hemorrhagic state of the labor force showing the number of those who have left the labor force since 2011. Remember, since they have “left” the labor force, i.e. have not looked for a job in the past four weeks they ARE NOT counted as unemployed. The last one shows the participation rate trend for the same time period. These are so ugly if they were art only a grant from the National Endowment for the Arts would commission them!
We can’t say it enough, policy matters…and these are not working to the benefit of the American worker, investor, employer and, consequently, family. We remain cautious regarding investments, expansion and hiring.
Thanks for reading and, please, stay tuned…
Release Site: www.bls.gov
Every effort is made to ensure accuracy of data transcription but accuracy cannot be guaranteed. The official release site should be cross referenced. The analysis represents the opinion of Blue World Asset Managers, Ltd. who does not warrant or guarantee predictions based on its analysis.
©Blue World Asset Managers, LTD Friday, January 10, 2014