Blue World Economic Index®
Scale: -2 to +2
Release Date: Usually the Last or First Business Day of Each Month
Release Site: www.blueworldassetmanagers.com
Management Value: Critical
Date Thursday November 2, 2017
Analysis
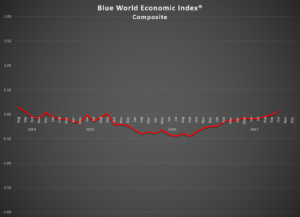
Happy Halloween! If you’re looking for a scare, the economy isn’t going to provide it. The Blue World Economic Index® broke into positive territory for the first time since September 2015 and is at the second highest level since the report has been published! We’re not saying were high enough above water for a human to both see and breath, but an alligator could. The analysis section will cover a bit more than usual in terms of individual reports.
Again, we see the move driven by some trends that demanded upgrades and a whole lot of anecdotal optimism measures, but that is not to say the hard data is still missing. The hurricanes had a small but seemingly very temporary effect. The Durable Goods report was strong and added more support to the regional Fed reports which, by the way, are so high they can probably be viewed at eye-level from the International Space Station! Regulations have been quietly rolled back in waves, and the prospect of a tax cut is still in play. The uncertainty surrounding investigations, indictments, nuclear war, etc. are all still serious risks to the optimism-fueled surge, but the momentum has proven quite resilient so far.
The FHFA House Price Index came in high and is what drove the BWEI® into positive territory late in the month (25th) and it never looked back. We’ve seen some intra-month positives on occasion, but they’ve never held.
Manufacturing is still growing and now both by survey and hard data. Empire State and Philly Fed earned very unusual 2’s for the month for blowing both last month and estimates out of the water. The Kansas City Fed and Sub-Fed composite hit new highs and hurricanes were not even a speed bump for the Dallas Fed region still being led by new orders and a Capacity Utilization at 10 year highs. The only downer in manufacturing all month was the Industrial Production Report.
GDP from last Friday was the second 3% reading in a row, but we need to see how artificial the inventories contribution was as a result of hurricanes; however, it was still enough to earn a short-term trend upgrade. Personal Income and Outlays was solid but for the inflation component although vehicle replacement after hurricanes helped so that will have to be monitored.
The Numbers
Five of the eight major categories are now in positive territory including Consumer, General, Manufacturing, Real Estate and Retail, with Employment, Services, and Inflation still posting in red ink. All but Employment, however, showed improvement over the course of October 2017. Employment is no surprise considering the abysmal showing last month which we hope to correct on Friday.
We hope to see you Friday morning for the Blue World Jobs Report Analysis. Until then, HAPPY HALLOWEEN and HAPPY THANKSGIVING. See you on or about December 1st as we hit the home stretch of 2017!
Every effort is made to ensure accuracy of data transcription but accuracy cannot be guaranteed. The official release sites should be cross referenced. The index assignments represent the opinion of Blue World Asset Managers, Ltd. who does not warrant or guarantee predictions based on the index.

