
Blue World Economic Index®
Scale: -2 to +2
Release Date: Usually the Last or First Business Day of Each Month
Release Site: www.blueworldassetmanagers.com
Management Value: Critical
Thursday, June 01, 2017
BETTER! BUT…
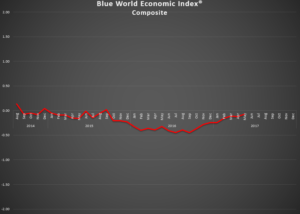
There is no doubt that the BWEI® and, therefore, the economy are moving, but in a rather unusual situation, May 2017 is a little skewed by some quarterly review and revision of the short and long term trends. Because we assign more weight to the trends than we do individual report data points, revisions here can have a seemingly dramatic effect on the Composite if there are more than the usual upgrades or downgrades in a given month. Such was the case this month. That’s good in that it means some positive trends that we just couldn’t deny any longer are developing but we should not get over excited knowing the disproportionate impact of multiple trend upgrades in a single month.
Caveats in place, let’s break it down. Real Estate took a bit of a drubbing in May 2017, dropping .17 from .31 to .14, mainly from a big drop in Construction Spending and a long-term downgrade to Existing Home Sales. The other seven reports for this category held up just fine. For the first time since the election, Consumer measures gave a little back. This was not, however, on the backs of the direct metrics of Sentiment, Comfort, and Confidence. It was more from the indirect reports such as Vegas Strip Gaming Revenues or the Gallup ECI being less strong.
General Measures and Inflation were unchanged for the month but within Inflation, Farm Prices and the Employment Cost Index are hinting at some pressure. Good to see.
Employment, Retail, and Services all showed some gains although the bump in Retail was modest and against a very low bar after April. The improvement in Employment is certainly taken more seriously in light of today’s ADP report. Let’s hope the BLS follows suit tomorrow.
So, what’s the huge news? If you’re counting you already know it is Manufacturing! The Fed Sub Group is still ginormous and growing with some trend upgrades. But, as we’ve said, much of those are anecdotal, survey-driven reports. We need to see some movement in the hard data to validate the optimism. Well, SOME showed up last month in that three out of six current reports posted positives with a positive overall average. Folks, it’s been a long time since that’s happened! In addition, the short and long-term trends of some of the non-Fed reports, like Factory Orders, commanded their short and or long-term trends be reviewed. All this yielded a pop of .37, taking the Manufacturing composite from -.18 to +.19. That’s what vaulted the overall Composite Index to a .05 jump versus what would have been closer to a .03 advance. Both scenarios are good and leave the final reading for May 2017 at -.07, up from April’s -.12.
Blue World Jobs Report Analysis will be out tomorrow. See you back here when the calendar says July!
Every effort is made to ensure accuracy of data transcription but accuracy cannot be guaranteed. The official release sites should be cross referenced. The index assignments represent the opinion of Blue World Asset Managers, Ltd. who does not warrant or guarantee predictions based on the index.
©Blue World Asset Managers, LTD Thursday, June 01, 2017