Jobs Report Analysis August 5 2011

Employment Situation Summary

Release Date:  Usually the first Friday of each month

Release Site: www.bls.gov

Market Relevance: VERY HIGH

Management Value: VERY HIGH

 Brain surgery is not rocket science to a brain surgeon.©

 Friday, August 05, 2011

 Blue World Employment Situation Analysis


We say this analysis is not about headlines and spin.  Sometimes it’s an easy thing to write and sometimes painful.  Like today.  The details of the report do not support the notion that the labor market is improving.  On the contrary.  The idea that it’s good to have 117k new jobs vs. an expected 75k in and of itself is an indication that things are bad.  In truth, the size of the civilian work force got smaller, the participation rate fell, the number of employed people fell and the number of people not in the labor force rose.  All this combines to produce an unemployment rate that is flat but will be touted as an improvement by many.  GDP was poor and revised down, mass layoffs have been in the news in that last week and on the rise, consumer confidence and CEO confidence is down, earnings are very mixed and outlooks are weakening.  All of the indicators affirm the lack of recovery and we have an economy still on the ropes.

 The markets opened with the predictable knee-jerk but at the time of writing exuberance is waning as the details of the report make their way into the collective awareness.

 Some Numbers:

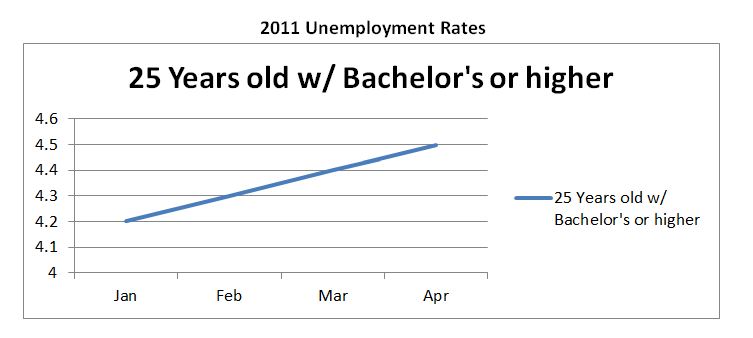
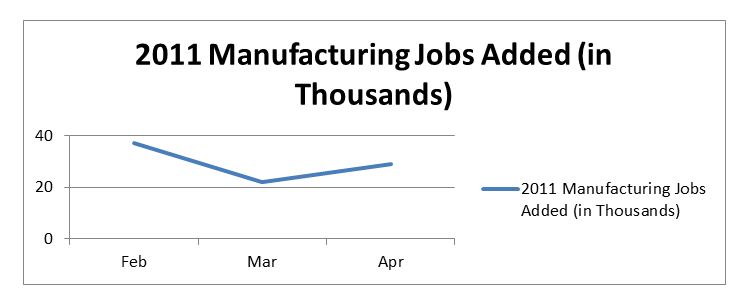
25+ with a bachelors and higher is still above 4%, and those working part-time for lack of full-time availability is up.  Average hours worked and overtime in manufacturing was flat at 41.4 and 4.1 hours per week, respectively.

 As we continue to observe, policy matters.

 We remain in a very defensive posture with our investment strategies and will for the foreseeable future.

Thank you for reading and…stay tuned!

Release Site: www.bls.gov

 Every effort is made to ensure accuracy of data transcription but accuracy cannot be guaranteed.  The official release site should be cross referenced for accuracy and footnoting.  The analysis represents the opinion of Blue World Asset Managers, Ltd. who are not giving advice and does not warrant or guarantee predictions based on its analysis.

 ©Blue World Asset Managers August 2011

Blue World Employment Report Analysis July 8 2011

Employment Situation Summary

Release Date:  Usually the first Friday of each month
Release Site: www.bls.gov
Market Relevance: VERY HIGH
Management Value: VERY HIGH

Brain surgery is not rocket science to a brain surgeon.©

Friday, July 08, 2011 

Blue World Employment Situation Analysis

Well, here we are.  Another month.  Another employment report.  Another batch of surprised “experts” and disappointed investors.  Why?  There are several “whys” to answer.  Another month is obvious and we know every new month brings a new report.  The only interesting thing about this one is that it occurs under the unusual situation of publishing on the second Friday of the month because the first Friday was on the first of the month in which case the data just isn’t ready, yet.  Why were the “experts” surprised?  Because instead of lifting their pointy little heads out of the cubicles and seeing the world around them they continue to rely on two dimensional data sets.  If you follow us on Twitter you know that we warn against knee-jerk reactions to the unreliable correlation between the weekly unemployment insurance application numbers, the ADP report and some other more obscure data.  Those are reasonable cursory numbers to consider but I would think the “experts” would eventually realize that they get burned by relying on them for predicting the BLS numbers more often than not.  I know we figured it out.  Wall Street is managed by its own set of “experts” who tend to follow the predications of the economic “experts” and have not yet reached the epiphany that the headlines they read after the report often invalidate  the interim prognostications with words such as “surprised” and “unexpected.”  That’s “WHY.”  Investors: There are no fundamentals to support a sustained market run and reality WILL catch up, eventually.  Play defense.  If you don’t know what that means PLEASE contact us.

mmatigian@blueworldassetmanagers.com 

The numbers are the numbers and they are worse despite some print we’ve already seen suggesting they are essentially unchanged.  Most notably the U-5 (Total unemployed, plus discouraged workers, plus all other persons marginally attached to the labor force, as a percent of the civilian labor force plus all persons marginally attached to the labor force) and U-6  (Total unemployed, plus all persons marginally attached to the labor force, plus total employed part time for economic reasons, as a percent of the civilian labor force plus all persons marginally attached to the labor force).  These are often referred to as the true un and under employed rate as the data captures more people who gave up, are on the fringes of looking for work and those employed part time because they simply can’t get full time work.  U5 has been consistently between 10.3% and 10.5% since February.  This month it is 10.7%.  U6 has remained within a .2% range of 15.7% – 15.9% for four months but for June shot up to 16.2%.  That is a staggering figure.  Our 25 year-old + crowd with a Bachelor’s degree, or higher, remain unemployed at historically reprehensible rates and the number of overtime hours required in manufacturing dropped in spite of the recent “glowing” reports in the media.

Policy matters, folks and this administration’s are absolutely destructive.  Perhaps lower taxes, fewer regulations and elimination of the uncertainty surrounding Dodd-Frank and Healthcare are worth a try…

We remain in a very defensive posture with our investment strategies and will for the foreseeable future.

Thank you for reading and…stay tuned!

Release Site: www.bls.gov

Every effort is made to ensure accuracy of data transcription but accuracy cannot be guaranteed.  The official release site should be cross referenced for accuracy and footnoting.  The analysis represents the opinion of Blue World Asset Managers, Ltd. who are not giving advice and does not warrant or guarantee predictions based on its analysis.

Blue World Employment Situation Report Analysis 06-03-2011

Blue World Employment Situation Report Analysis

Release Date:  Usually the first Friday of each month

Release Site: www.bls.gov

Market Sensitivity: VERY HIGH

Management Value: VERY HIGH

Friday, June 03, 2011

Brain surgery is not rocket science to a brain surgeon ©

If we were feeling lazy we would change the date on the analysis from last month, publish and head for the lake…

But, unfortunately, it’s worse than that.  Do we need to say the “experts” were surprised?  The jobs pick-up continues to be woefully inadequate to keep pace with the current jobless much less the new entrants to the work force.  The BLS summary paragraphs are somewhat perplexing, if not misleading, citing “continued” improvement in some areas that the stats just don’t support.  Any improvements continue to be more a result of slower layoffs than “new” jobs being created.  Even that phenomenon coupled with the number of those falling off the reporting radar, which led to statistical drops in the overall rate but not a real drop in the number of unemployed over the past year, was not enough to prevent a rise from 9.0% in April to 9.1% in May.

We object to the characterization that a rise of .1% equates to little change.  First of all, .1% of the total work force is one helluva lot of real people who are struggling and suffering.  Secondly, the manner in which a drop of .1% is heralded as a policy vindication and a sure sign things are looking up betrays an unconscionable hypocrisy on the part of many authors and commentators.  This is a summary of the employment status of real people in the United States.  Analysis of the objective data and what it says about policy effectiveness and business prognostication is appropriate.  Spin is not.  It is what it is and it continues to be bad.  We can’t stress it enough, folks.  We don’t care what works.  All we care is that it works.  Policy matters.

Here are a few “low-lights” from the data:

Our favorite barometer, the unemployed rate for those 25+ with a Bachelor’s or higher, remains at a staggering 4.5%.  This is one of those areas the BLS suggested showed improvement, but we don’t see it in the numbers.  This month we think it is appropriate to break this down a little further:

Eligible job seekers: (Worse/Better/Unch refers to the total unemployment rate for the group identified)

  • All 16+: Worse
  • Teenagers 16-19: Better
  • Men 20+: Worse
  • Women 20+: Worse
  • White: Unch.
  • Black: Worse (and worst in group; since Mar. 15.5%, 16.1%, 16.2%)
  • Asian: Worse
  • Hispanic: Worse
  • 25+
    • Less than a H.S. diploma: Worse
    • H.S. diploma: Better
    • Some college or associates: Worse (up.5% from April to 8.0)
    • Bachelor’s or higher: Unch.

Average weekly hours worked and overtime remained flat and the number unemployed for more than 27 weeks increased.  Health, education and social services remain the bright spot but that is roughly analogous to a firefly in the middle of a corn field on a cloudy night..during a lunar eclipse.  There is a lot of additional data that could be cited but we think we get it.

Anyone truly surprised by this data is either not paying attention or has achieved “expert” status.  GDP was just revised downward (as Blue World has been telling us it would), the currency is weakening (as Blue World has been telling us it would), and inflation is becoming an ever-increasing problem (as Blue World has been telling us it would), so let’s dispense with the contrived shock and awe, innocent ignorance, blatant stupidity, and dishonest analysis and opinion, shall we?  What our elected officials are doing is not working.  There is no crime in that.  The crime comes when the elected officials see it isn’t working and refuse to change course.  When it’s this bad everyone can see it.  Everyone can also see there is no sign of a shift in policy.  Thinking folks have no choice but to assume an elite few have it just the way they intended.

As always, we appreciate the time you take to read us.  Please, stay tuned…

Release Site: www.bls.gov

Every effort is made to ensure accuracy of data transcription but accuracy cannot be guaranteed.  The official release site should be cross referenced.  The analysis represents the opinion of Blue World Asset Managers, Ltd. who does not warrant or guarantee predictions based on its analysis.

© Blue World Asset Managers, LTD Friday, June 03, 2011

Blue World Employment Situation Summary 05-06-2011

Release Date:  Usually the first Friday of each month
Release Site: www.bls.gov
Market Sensitivity: VERY HIGH
Management Value: VERY HIGH

Friday, May 06, 2011

Brain surgery is not rocket science to a brain surgeon

 Extra, Extra, Read all about it: Jobs Report Surprises Experts!!!

 An ugly duckling with no swan in sight.

 I hate to rain on the “expert’s” parade but the jobs report is not good, it is not mixed and it is NOT a surprise.  The employment report is bad.  Period.    We predicted Wall Street would get past the headlines and into the detail shortly after lunch.  They did. 

An optimistic estimate is that about 1.5 million jobs have been added over the last year or so.  Conservatively, that puts us about 7.5 million jobs behind where we were before the crash.  This is not a recovery profile.  It is the (predictable, mind you) profile of an economy bouncing along the bottom waiting for something to send it toward the surface.  Unfortunately, there continues to be no catalyst for any bump in demand and, therefore, no reason to hire at the rate required to improve the overall picture.  On the contrary, some of the problems we’ve been saying were laying in the weeds for the last year are starting to poke their heads up and make some noise loud enough for even the “experts” to hear.  Most notably, of course, is inflation.  If things cost more to make and more to transport eventually they’ll cost more to buy.  The cost of food and fuel, you know the stuff that the “‘experts” say we shouldn’t count in inflation, will drive the cost of everything sooner or later.  For us it’s sooner but even the “experts” seem to be catching on, lately.  But there’s a double whammy.  Just to make sure inflation has a friendly environment to thrive in the Fed (big collection of “experts”)  decided to buy some debt (effectively borrow money from itself) with printed money.  That’s important; not money created by increased GDP and productivity.  It was new money essentially photocopied to buy loans made to us by us.  That dilutes the value of a dollar so, by default, it takes more of them to buy things = inflating prices.  The en vogue, sexy term is “Quantitative Easing”.  When inflation didn’t kick up fast enough they decided to do it again.  This time they gave it an even catchier moniker: “QE2”.  We’ll just call it “dumb and dumber.” 

 To the numbers, then…

We added 244 thousand paychecks and the unemployment rate went up to 9.0%.  This is the volatile labor force size phenomenon we have been describing for the last few months. 

 Most of you know our MVS (Most Valuable Stat) is the unemployed rate for those 25 years old and older with a 4-year college degree, or higher.  Their unemployment rate for April was 4.5%.  That’s bad enough.  The 2011 trend is very unsettling.

 There were 244 thousand private sector jobs added but the number of persons unemployed for less than five weeks rose by 242 thousand.  Those are new job losses.  That is an ominous sign, especially in light of the current “slow-down.”

The number of people working part time because they could not find full time employment increased and the number of marginally attached and discouraged workers (leaving the labor force) is on the rise, again.  Total weekly hours worked and overtime in manufacturing, both indicators of demand, fell slightly even though there is some pant-wetting over modest payroll increases.  This month’s increases follow a recent pattern that is grossly flat. 

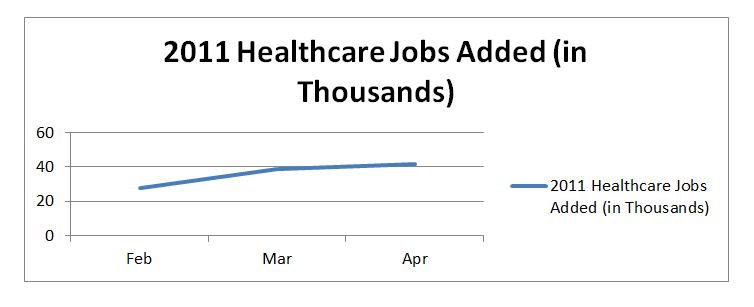
While the Establishment Survey has some bizarre looking spikes and dips, hospitality, retail, and healthcare showed the strongest gains.  Of those healthcare is the only segment that demonstrates a stable positive trend in hiring although the monthly gains are uninspiring at just fiver figures.


There are several more numbers that help round out the same story.  For a closer look please follow the link at the top or bottom of the page to the official BLS release site.  In the mean time we say keep that defense on the field of investing whether that field is buying stock, hiring employees or anything else that real people who invest real money do.  We’ll be content to let the “experts” continue theorizing from their cubicles and getting surprised when real data generated by the rest of us inconveniences their brilliance!


Thanks for reading and, please, stay tuned…


Release Site: www.bls.gov


Every effort is made to ensure accuracy of data transcription but accuracy cannot be guaranteed.  The official release site should be cross referenced.  The analysis represents the opinion of Blue World Asset Managers, Ltd. who does not warrant or guarantee predictions based on its analysis.

Employment Situation Summary for Friday, March 4, 2011

Employment Situation Summary

Release Date:  Usually the first Friday of each month
Release Site: www.bls.gov
Market
Relevance: VERY HIGH
Management Value: VERY HIGH

To learn about the official release please follow:
http://www.blueworldassetmanagers.com/explanation.html
Friday
, March 04, 2011

Blue World Employment Situation Analysis


The Devil is in the details

OK, you know the words.  Wanna sing along?  The jobs data is uninspiring and that should continue to be of little surprise.  A significant deterioration? No, just flat.  There are simply no catalysts for robust growth.  On the contrary.  The health care law is still a wild card, banks are being forced to write down troubled loans (that means give away money), commercial debt is still the elephant in the room, commodities are soaring, there is turmoil in the middle East, U.S. military are being executed in European streets and politicians are running and jumping into hot tubs in neighboring states to avoid votes on cost-cutting they fear will pass.  HOW DO WE THINK PEOPLE WHO INVEST REAL MONEY, MAKE REAL PRODUCTS AND HIRE PEOPLE WILL BE INSPIRED?

To the numbers:

192,000 new jobs.  That’s the good news?  No, that’s the headline.  While we added those 192,000 jobs we removed 200,000 people from the unemployed count because they have not sought work in the last 4 weeks.  We know they are out there because they did look for work within the last 12 months but because they did not look during the last 4 weeks they don’t count.  What this means is that more people were eliminated from the count than got jobs.  That is how the rate (8.9%) continues to drop while the unemployment picture is not meaningfully improving.

The participation rate is down since last February and flat since December 2010.  The number of discouraged workers rose.  The number of workers whose primary and secondary jobs are both part time is higher than a year ago.  Average weekly hours worked, including overtime, are broadly flat across all workers (as opposed to non-supervisory) in tracked categories for the last 3 months.  Significantly, those with a Bachelor’s degree, or higher saw another uptick in their unemployment rate (4.2% to 4.3%) over January. Conversely, the unemployment rate in the less-than-a-high school-diploma category is trending down.  It improved .3% from 14.2% in January to 13.9% in February and from 15.3 in December 2010.  These ends of the educational/employable spectrum indicate the quality of jobs being filled which does not inspire confidence for a breakout recovery.  We have seen it reported that part time for economic reasons (poor demand environment) improved.  That’s true for the all industries category. If, however we look at non-agricultural industries (the more relevant figure) we see that the situation actually got a bit worse.

If you are looking to spin the report as “positive” or “encouraging” are there figures you can point to?  Sure.  But looking into the detail there is still plenty of reason for caution, too.

We remain in a very defensive posture with our investment strategies and will for the foreseeable future.

Thank you for reading and…stay tuned!

Release Site: www.bls.gov

Every effort is made to ensure accuracy of data transcription but accuracy cannot be guaranteed.  The official release site should be cross referenced for accuracy and footnoting.  The analysis represents the opinion of Blue World Asset Managers, Ltd. who are not giving advice and does not warrant or guarantee predictions based on its analysis.