Blue World Jobs Report Analysis 5-2-2014

Blue World Employment Situation Report Analysis

Release Date:  Usually the first Friday of each month

Release Site: www.bls.gov

Market Sensitivity: VERY HIGH

Management Value: VERY HIGH

Friday, May 02, 2014

Brain surgery is not rocket science to a brain surgeon©

Inigo1

“You keep on using that word.  I do not think it means what you think it means.”

Some of the best job growth of the “RECOVERY!” 

We see sentiments like that all over from the “experts” this morning.  What a great example of why reports need to be analyzed.  The number of new jobs posted was an eye-widening 288k.  That is the best figure in a LONG time.  And then…reality takes over.  For perspective, 288k would be a great number to see early in an actual recovery, but for growth periods (like the one we should be in after 8 or 9 recovery months) it would be quite on the low average side.

Take a look at the futures reaction to the news.  It’s easy to see when they started seeing the details.

Futures after news May 2 2014

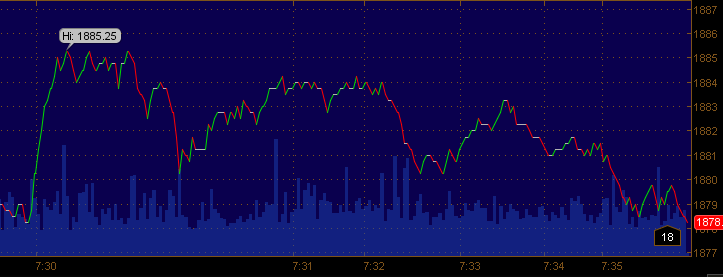
We would have expected very little change over the month as there were no momentous economic or policy shifts during April that would inspire a meaningful change, and we are, unfortunately, correct.  So, let’s get to it…

The headline number is 288k new hires for April 2014.  The unemployment rate dropped to 6.3%.  Net revisions to February and March 2014 numbers gives us a net gain of 36k.  That’s the end of the “good” news.

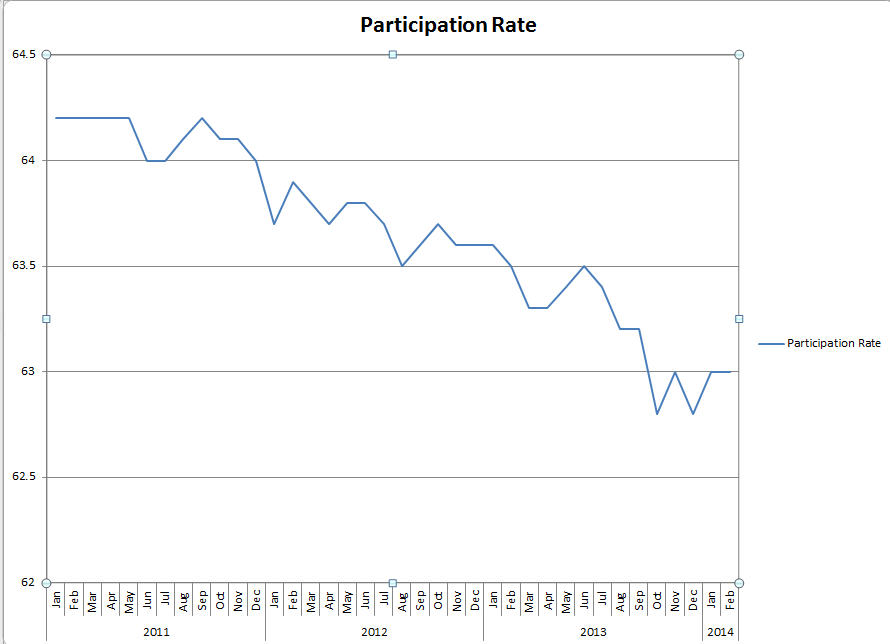
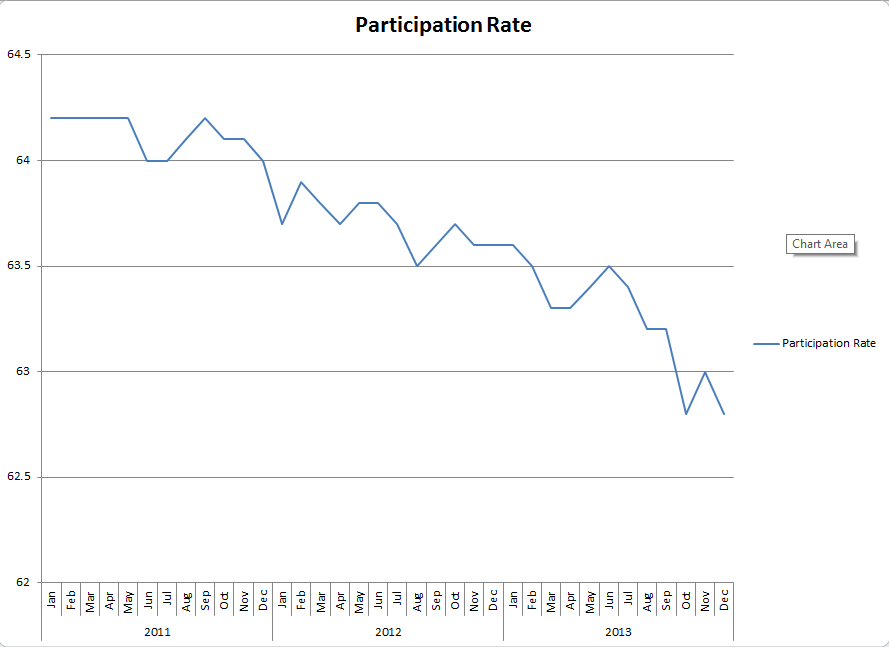
As for the 288k, only 273k are private sector adds.  Of that 273k, 32k are in construction.  That number represents a catch-up spike from the weather driven slowing in the sector.   As before, the rate changed disproportionately to the number of jobs added.  The unemployment rate decline of .4% matches the decline in the participation rate…exactly!  The participation rate fell another jaw dropping .4% in a single month.  It now stands at 62.8%, which you may recall is an all-time record low set back in October of 2013 and repeated in December.  Again, for perspective, had the participation rate remained steady from last month, the unemployment rate would have risen to 6.9%.  288k looks great until we hold it up against:

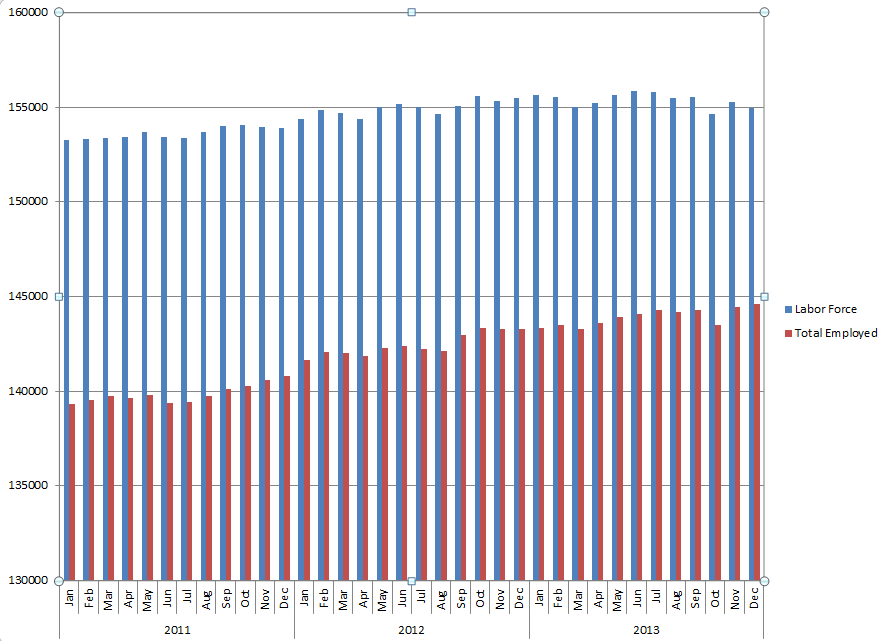
  • Civilian Labor Force shrank by 806k
  • Number of Employed People fell by 73k
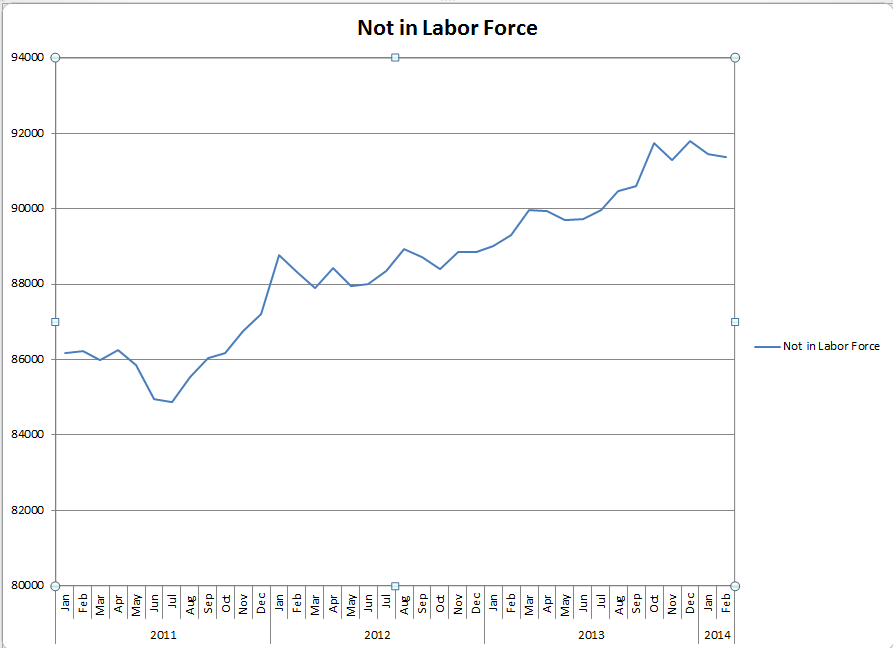
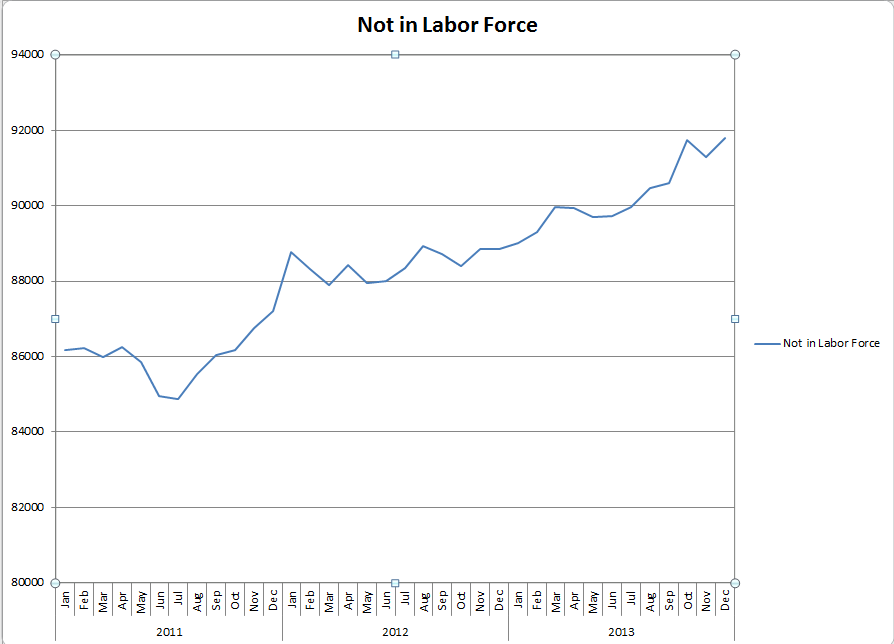
  • Those not in the Labor Force ballooned by 988k

The only other number one could be excited about would be the decline of 733k in the number of unemployed persons, until we realize that the those are the folks who quit looking for work a month ago so they don’t count in the rate calculation.

The length of the work week is stagnant, overtime in manufacturing was unchanged resting at 3.5 hours, earnings are flat and those employed part time for economic reasons continues to rise.

So, we’ve now established and matched the worst labor participation rate in American history three times in the last seven months with over ten million people out of work.

Recovery?

 Vizzini 5-2-142

INCONTHEIVABLE ! ! !  

Thanks for reading and, please, stay tuned…

 Release Site: www.bls.gov

1,2 “The Princess Bride” Act III Communications 1987

Every effort is made to ensure accuracy of data transcription but accuracy cannot be guaranteed.  The official release site should be cross referenced.  The analysis represents the opinion of Blue World Asset Managers, Ltd. who does not warrant or guarantee predictions based on its analysis.

©Blue World Asset Managers, LTD Friday, May 02, 2014

Blue World Jobs Report Analysis 4-4-2014

Blue World Employment Situation Report Analysis

Release Date:  Usually the first Friday of each month

Release Site: www.bls.gov

Market Sensitivity: VERY HIGH

Management Value: VERY HIGH

Friday, April 04, 2014

Brain surgery is not rocket science to a brain surgeon©

How often did you find yourself in math class laughing out loud because arithmetic was so funny?  It is so rare for remedial math to be entertaining that we feel obligated to revisit the who’s-on-first dynamic of the employment numbers relative to the unemployment rate.  In January we added 145k, and the unemployment rate got better.  In February we got 162k, and the rate got worse.  Now we get 192k and rate is – wait for it – UNCHANGED!

By now most of us have heard the 192k with an unchanged rate of 6.7% headlines, so let’s do what we do and take a look at what it really means.

As usual, there were no seismic changes during March 2014, so we would expect that things are about the same, and they are…with a couple of insidious trends emerging that are way off the radar of the media folk  and “experts.”  We’ll get to those in a bit.

The “expert” consensus called for about 206k new hires with estimates covering a wide range from 175k on the low side to 275k on the high end.  Emphasis on the last in recognition of the likelihood that particular “expert” is from Colorado, voted in favor of the referendum to legalize pot and was partaking when rendering his estimate!  The 192k number is the net for total private hires as government neither added nor lost jobs for the month.  There was a significant upward revision to the February number from 175k to 197k, but that is still way short of what we’d consider acceptable in “normal” times much less 5 years into a “recovery.” (BTW, even with that revision the rate is ‘unchanged’)

The participation rate remains in record low territory, and in spite of an increase of .2 to 63.2, it languishes below the level of a year ago.  This is, of course, continued evidence of the bleeding of available work force.  Those workers 25 years and older with a Bachelor’s degree or better remain frustratingly unemployed at historically high rates.

The work week ticked up a bit but remains range bound and is no better than it was in March of 2013.  Average hourly wages moved backwards while weekly earners fared a little better, and overtime hours in manufacturing remains tightly range bound.

Now for the more insidious stuff…

Those employed part-time for economic reasons appear to be stair-stepping upward.  There were notable increases in the number of those unemployed between zero and 26 weeks, and the number of unemployed people rose in spite of the jobs total, participation rate and marginally attached number.  However, the big one comes from the oft-overlooked diffusion index in manufacturing.  To review, the diffusion index looks at the manufacturing sector as a whole, which is composed of 81 industries.  A diffusion index of 50 indicates as many industries added or remained neutral in terms of new hires as shed jobs.  For the first quarter of 2014 the index has declined January to March at the attention getting rate of 55.6, 51.9, 50.0.  Those numbers are rather startling but it gets worse when we look back and see that in March of 2013 the rate was 52.5.

If you run a business, manage people, invest real money or seek to make a meaningful contribution to the economy the posture must remain defensive because in spite of the irrational public markets behavior, false or foolish optimism, headlines and spin, we have no choice but to conclude that the “recovery”…well…isn’t.

Thanks for reading and, please, stay tuned…

Release Site: www.bls.gov

Every effort is made to ensure accuracy of data transcription but accuracy cannot be guaranteed.  The official release site should be cross referenced.  The analysis represents the opinion of Blue World Asset Managers, Ltd. who does not warrant or guarantee predictions based on its analysis.

©Blue World Asset Managers, LTD Friday, April 04, 2014

Blue World Jobs Report Analysis 03-07-2014

Blue World Employment Situation Report Analysis

Release Date:  Usually the first Friday of each month

Release Site: www.bls.gov

Market Sensitivity: VERY HIGH

Management Value: VERY HIGH

Friday, March 07, 2014

Brain surgery is not rocket science to a brain surgeon©

Sure, we could sequence copy/paste from last month and call it a day, but if we did that we’d ignore some really high quality comedy!  The weather?  REALLY? THE WEATHER?  This is another absolutely miserable report, but don’t worry, the experts say it’s just due to the weather.  Ya know, the really brutal winter… Asking people who invest real money and employ real people to believe that is asking them to believe that the winter of 2014 began in August of 2007!  We certainly understand the need to spin this as best as possible for political and keep-the-rank-and-file-in-the-market reasons, but we’re here to help those who seek to exert a positive impact on the economy.  We do this by offering an analysis that allows decisions to be based on reality.  How many times can we say it – We can’t make the labor market stronger by making the labor force smaller!

You just can’t beat this math phenomenon.  Last month we added 145k jobs and the unemployment rate “improved.”  This month we add 162k, and the rate gets worse!  The “improving” unemployment rate has been due to the problem of a positive denominator outpacing a stagnant numerator.  This month that was slightly reversed, as it has been on occasion, but as you’ll see in the graph below it’s the same old pattern.  It continues to provide us an artificially low and misleading unemployment rate that can be utilized for headlines but has absolutely no value for investors and business managers. 

I know they are reporting 175k new positions, but that includes government jobs.  To measure the economy we only care about hires in the private sector, and there we added only 162k new payrolls.  The participation rate held at 63% in February 2014 which remains in all-time record low territory.  The work week pulled back and remains range bound.  What struck us, however, is that it is three tenths of an hour shorter than a year ago.  That’s significant.  There were noticeable work week decreases in the sector-by-sector analysis including overtime hours in manufacturing, which has now been trending downward for the last four months.  The largest declines were noted in construction hours, which is really the only place we can blame the weather at all.  Wages remain uninspiring across the board and those who are at least 25 years old holding a Bachelor’s degree or better are unemployed at a rate of 3.4% in February 2014.  That number has been on the rise of late and remains in historically unseen territory, the last six years notwithstanding. 

Like we always say, one report is never valuable unto itself.  Trends are important.  There are a multitude of other stats we could cite from this report, but they are predictable and redundant at this point.  Instead we offer the following updated graphs to show what we silly non-experts already knew…nothing’s changed!

Thanks for reading and, please, stay tuned…

Feb Force vs Employed

Feb Part Rate


Feb Not In Force


Release Site: www.bls.gov

Every effort is made to ensure accuracy of data transcription but accuracy cannot be guaranteed.  The official release site should be cross referenced.  The analysis represents the opinion of Blue World Asset Managers, Ltd. who does not warrant or guarantee predictions based on its analysis.

©Blue World Asset Managers, LTD Thursday, March 06, 2014

Blue World Jobs Report Analysis 02-08-2014

Blue World Employment Situation Report Analysis

Release Date:  Usually the first Friday of each month

Release Site: www.bls.gov

Market Sensitivity: VERY HIGH

Management Value: VERY HIGH

Friday, February 07, 2014

Brain surgery is not rocket science to a brain surgeon©

As human beings, I believe the reason others are capable of disappointing us is because most of us assume that others will react as we would to a given situation.  When we learn that not everyone sees things the way we do it becomes difficult to be surprised or disappointed by others.  The same, of course, holds true for data.  Already we see the word “disappointing” all over the media regarding the jobs report.  They, inexplicably, also continue to use the word “recovery.”  We don’t consider this report “disappointing” when things are just as all the other indicators have suggested they would be.  After all, what’s changed that would lead anyone to believe that things would improve by any meaningful degree since December 2013?

The headlines posted 113K new jobs.  The meaningful news is actually a little better than that.  The 113K reflects “total non-farm” employment.  That includes government jobs.  We are more interested in the “total private” number which was actually 142K.  Government shed 29K jobs in January leaving us with a net of 113K new payroll tallies for January 2014.   In either case, please remain mindful that we require about 250K new jobs per month to break even on those becoming eligible to work.

The number of those unemployed came down a bit, and the employed number as well as the participation rate “improved” slightly.  The quotes are in aid of the fact that this is an all too familiar pattern of these stats making lower highs and lower lows.  For example, the participation rate rose by .2%.  This gets it up to 63%.  63% was an all-time record low reported in the November 2013 release.  The number stood at 63.6% in January of 2013.  This is a continuation of a downward stair-step pattern that goes back over five years. 

The work week remained flat, and overtime hours in the manufacturing sector actually retreated slightly. Both measures of the time the economy needs from workers each week remains range bound and offers no indication of escalating need for additional workers anytime soon.

Consider all this back-dropped against the recent CBO report that indicated the Affordable Care Act can be expected to further drag the economy and cost us about 2.5M more full time jobs over the next few years.   That report can be found in the Wall Street Journal article titled, “.”

Disappointing?  Perhaps for the “experts” who were “surprised” by the weak data, but please forgive them.  They don’t know what you and I do.  We’ll only be “disappointed” if we fail to realize that nothing’s changed!

Thanks for reading and, please, stay tuned…

Release Site: www.bls.gov

Every effort is made to ensure accuracy of data transcription but accuracy cannot be guaranteed.  The official release site should be cross referenced.  The analysis represents the opinion of Blue World Asset Managers, Ltd. who does not warrant or guarantee predictions based on its analysis.

©Blue World Asset Managers, LTD Friday, February 07, 2014

Blue World Jobs Report Analysis 01-10-2014

Blue World Employment Situation Report Analysis

Release Date:  Usually the first Friday of each month

Release Site: www.bls.gov

Market Sensitivity: VERY HIGH

Management Value: VERY HIGH

Friday, January 10, 2014

Brain surgery is not rocket science to a brain surgeon©

Happy New Year, everyone.

Capture

Hey, can you smell that?  The jobs numbers are out.  Not only do they stink, the headline stinks even worse!  We would be remiss if we didn’t mention the claims made by our esteemed leaders that unemployment benefits create jobs.  Yes, Pelosi, Obama and Durbin have all said it repeatedly.  Based on the record number of those receiving jobless benefits there should be more jobs than available workers to fill them with an unemployment rate less than zero!  Sadly, neither is true because…wait for it…unemployment benefits DO NOT create jobs.

The unemployment rate fell .3% to 6.7%!  That’s good, right?  SORRY.  Ask yourself, does it make sense that 74,000 jobs could move the needle .3% when 203K the month before (now revised to 241k) could only move it .2%?  We witnessed another huge exodus from the labor force in December, so we continue to see our painfully long trend of more people leaving the labor force than getting jobs. That gives us an increasingly artificial, distorted, misleading and frankly invalid unemployment rate.

There was a decrease of 490K unemployed people, but that isn’t because they got jobs.  It’s because they left the labor force as demonstrated by the half-a-million increase in the number of those not in the labor force and a participation rate that matched its HISTORICAL ALL TIME LOW of 62.8%.  The number of those at work part-time due to slack work or couldn’t find full-time jobs, marginally attached workers and discouraged workers are all up by dishearteningly large numbers, leaving the more accurate unemployment rate just over 13%.  The work week remains range bound and wages grew by a paltry 1.8% year-over-year.  That is of concern when considering the Fed’s recent statements regarding anxiety over inflation.

Below are a few striking graphs.  The first graph gives us the complete picture of those employed relative to the total available work force for three complete years, 2011, ’12, and ’13.  The second demonstrates the hemorrhagic state of the labor force showing the number of those who have left the labor force since 2011.  Remember, since they have “left” the labor force, i.e. have not looked for a job in the past four weeks they ARE NOT counted as unemployed.  The last one shows the participation rate trend for the same time period.  These are so ugly if they were art only a grant from the National Endowment for the Arts would commission them!

Bar - Force vs. Employed

Not in Labor Force 1-14

Participation Rate 1-14

We can’t say it enough, policy matters…and these are not working to the benefit of the American worker, investor, employer and, consequently, family.  We remain cautious regarding investments, expansion and hiring.

Thanks for reading and, please, stay tuned…

Release Site: www.bls.gov

Every effort is made to ensure accuracy of data transcription but accuracy cannot be guaranteed.  The official release site should be cross referenced.  The analysis represents the opinion of Blue World Asset Managers, Ltd. who does not warrant or guarantee predictions based on its analysis.

©Blue World Asset Managers, LTD Friday, January 10, 2014