Blue World Employment Situation Summary 1-6-2012

Blue World Employment Situation Report Analysis

Release Date:  Usually the first Friday of each month

Release Site: www.bls.gov

Market Sensitivity: VERY HIGH

Management Value: VERY HIGH

Friday, January 06, 2012

Brain surgery is not rocket science to a brain surgeon©

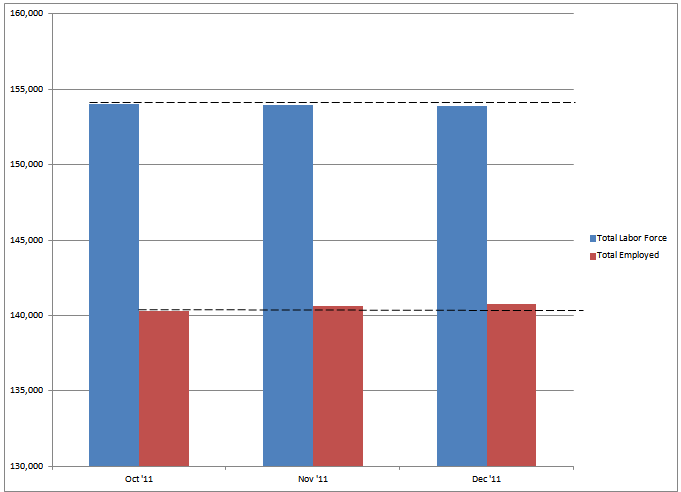
We’re afraid there is more hocus pocus in the jobs data this month.  As was true last month the labor force continues to shrink while the number of employed people rises.  That creates the appearance of an improving labor market but it simply isn’t the case.  If that does not make sense please review our clarification post from last month at http://owl.li/8kHlp .  

We are always amused at the markets graphic response to the announcement and subsequent movement as the detail is understood.  At this time it appears the details are out as the S&P meanders between down and flat.

They’ve reported 200k new jobs and a rate that fell .2% to 8.5%.  That fall is consistent with the phenomenon described above and graphed below.  As you can see, the total work force continues to contract as the number of those employed rises yielding a lower unemployed percentage in spite of a stagnant labor market. (Source: www.bls.gov)

But, like we always say, the headlines are useless without the detail so let’s take a look. 

The unemployed rate for those who hold a Bachelor’s degree or higher and are over 25 years old remained in a narrow and unacceptable range over 4% (average 4.35% for 2011).  There is much ado being made about the drop in the number of unemployed for over 27 weeks.  What we don’t see is a discussion of the rise in those unemployed for less than 5 weeks and that number is flirting with the December 2010 levels.

The length of the work week for manufacturing along with overtime hours and pay remains flat. 

Even though the number of those unemployed for over 27 weeks appears to be down we were surprised to see the average duration of unemployment to have ticked up, slightly. 

For some year-over-year analysis, from December 2010 to December 2011 the number of those holding multiple jobs has increased and those whose primary and secondary jobs are both part time also rose.  Perhaps more disturbing is the finding that those spending varying amounts of time on their primary and secondary jobs also rose.

We don’t like negativity and we don’t view this and previous analyses as positive or negative.  They simply are what they are.  The data is the data.  We appreciate the desire/need to put a positive  spin on it for social, economic and political reasons but if you are in a position of responsibility for business or investment management the truth is an absolute necessity.  We hope this helps.

Thanks for reading and, please, stay tuned…

Release Site: www.bls.gov

Every effort is made to ensure accuracy of data transcription but accuracy cannot be guaranteed.  The official release site should be cross referenced.  The analysis represents the opinion of Blue World Asset Managers, Ltd. who does not warrant or guarantee predictions based on its analysis.

©Blue World Asset Managers, LTD Friday, January 06, 2012


Blue World Employment Report Analysis 12-02-2011

Blue World Employment Situation Report Analysis

Release Date:  Usually the first Friday of each month

Release Site: www.bls.gov

Market Sensitivity: VERY HIGH

Management Value: VERY HIGH

Friday, December 02, 2011

Brain surgery is not rocket science to a brain surgeon©

We’re short on time today due to an engagement but this won’t take long.  The number of jobs rose by 120k.  That was below the consensus estimate of 125k and continues to be inadequate to keep pace with new entrants much less gain ground on the jobs lost.  Have you seen the futures graphs?  The headline was reacted to and then the details were read.  There are some Europe concerns mixed in but the 8.6%, down from 9.0% is what will get the attention.  This, unfortunately, continues to be reflective of the mathematical phenomenon of an increase in the number of jobs but a decrease in those counted as looking for work hence a lower ratio in spite of a still ailing labor market .  The number of marginally attached and discouraged workers rose. 

Despite what some other authors are already calling a “fishy” drop in the overall rate the unemployed rate for those over 25 with a Bachelor’s degree or higher, (our favorite barometer) remained unchanged.  Manufacturing added very little and showed a much smaller increase than last month.  The construction industry lost more jobs.

The work week hours stayed the same (we need to see it lengthening) and wages actually pulled back slightly.

As always, folks, it’s not rocket science.  Global uncertainty coupled with stifling regulation from a business unfriendly administration will simply not stir confidence and demand.  That’s not a political position.  It’s an economic reality. 

We look for continued volatility in the jobs report and other major economic releases over the next few months with concurrent market gyrations exacerbated by global, particularly European, news.  We will keep the defense on the field, one eye on the U.S. , one eye abroad and both hands on the wheel.

Thanks for reading and, please, stay tuned…

Release Site: www.bls.gov

Every effort is made to ensure accuracy of data transcription but accuracy cannot be guaranteed.  The official release site should be cross referenced.  The analysis represents the opinion of Blue World Asset Managers, Ltd. who does not warrant or guarantee predictions based on its analysis.

©Blue World Asset Managers, LTD Friday, December 02, 2011

Blue World Employment Situation Report Analysis 11-04-2011

Blue World Employment Situation Report Analysis

Release Date:  Usually the first Friday of each month

Release Site: www.bls.gov

Market Sensitivity: VERY HIGH

Management Value: VERY HIGH

Friday, November 04, 2011

Brain surgery is not rocket science to a brain surgeon© 

Do you ever watch the real-time futures charts on a major economic release day?  It is always, uh, entertaining.  This morning is no exception.  There is usually a wild knee-jerk reaction as soon as the data are released and it often whipsaws as no one can figure out from the headline if they are happy or sad.  Over the next hour the graph will reflect the reading of the detail, and by lunch either a trend for the day is established or thwarted by other news or, sometimes it seems, a short attention span!

We have not yet read any other analysis, but we can predict the tone.  The overall rate has fallen (unconvincingly) as fewer are reported unemployed against a slightly smaller labor force.  Once in the detail, however, we see an employment picture that has, very predictably, remained essentially unchanged.  And why wouldn’t it?  Anemic demand and uncertainty still dominate a private sector under the supervision of a business unfriendly, regulation-happy administration.

Those with a Bachelor’s degree, or higher, find themselves unemployed at 4.4%.  That, as our readers know, is a historic high and actually got a bit worse in October.  Table 15, U-5 shows no change in the discouraged and marginally attached crowd.  It will, undoubtedly, be trumpeted that those unemployed less than 5 weeks and over 27 weeks has declined.  I suspect we’ll hear little about the jump in those unemployed 5-14 weeks as that hump moves across the calendar.  The decrease in 27+ may well coincide with those truly unemployed who aren’t counted as such because they have not looked for work in the past 4 weeks although they remain available and willing.

Unfortunate or fortunate there should be no real surprises this month.  We’ll just have to keep relying on those futures charts for excitement.  Ahh, 46 minutes post release the trend is decidedly down.  Let’s see if lunch is enough to forget the details.

Thanks for reading and, please, stay tuned…

Release Site: www.bls.gov

Every effort is made to ensure accuracy of data transcription but accuracy cannot be guaranteed.  The official release site should be cross referenced.  The analysis represents the opinion of Blue World Asset Managers, Ltd. who does not warrant or guarantee predictions based on its analysis.

©Blue World Asset Managers, LTD Friday, November 04, 2011

Blue World Employment Situation Report Analysis 10/07/2011

Blue World Employment Situation Report Analysis

Release Date:  Usually the first Friday of each month

Release Site: www.bls.gov

Market Sensitivity: VERY HIGH

Management Value: VERY HIGH

Friday, October 07, 2011

Brain surgery is not rocket science to a brain surgeon©

Well, folks, you can be disappointed all you want but if you’re surprised you haven’t been paying attention (or at least not reading Blue World.)  The report is another bad one and that can’t come as any bigger surprise than the prior several months.  Costs remain high, consumers are unemployed and, as of September, manufacturing workers are making no more money than they did in the summer.  This keeps demand low and businesses cautious.  Help on the horizon?  We think not.  The so-called “Jobs Bill” being promoted by the White House (and avoided by Senate Democrats) is a stimulus bill with a new name because “stimulus” has justifiably become a dirty word.  Are there some tax reductions in the bill?  Yes.  Are tax reductions good?  Usually but not when they are insignificant window displays in front of a warehouse full of bad policy.  One-off tax breaks cannot improve demand or bolster optimism when used as gimmicks and enticements for what is otherwise an anti-private-sector-business-for-profit philosophy.  That’s true no matter which party tries it.  The people who invest real money and hire real people won’t fall for that nonsense.  They have too much real capital at risk.  Tax reductions only matter when they are the instruments in validation of a complete business-friendly platform.

The numbers?  O.K.  You asked for it.

The overall rate was unchanged at 9.1%.  If that now seems like GOOD news we are in a lot of trouble.  Below the headlines we find the unemployment rate for those 25+ and holding a Bachelor’s degree or higher remaining in an unacceptable range between 4.1 and 4.5%.  Table A-15, Row U-6 showing the total unemployment rate including marginally attached and discouraged workers rose from 16.2% to 16.5% on a seasonally adjusted basis (summer jobs ending, for example.)  Those unemployed for less than 5 weeks and more than 27 weeks also increased.  That is bad news at both ends of the bookshelf especially when considering those working part-time for economic reasons (not enough work or could only find part time employment) also rose.  Some are trying to spin the addition of part-timers as a good thing.  The problem is WHY they are part time.  It is not an indicator, in this case, of rising employer optimism.  That’s also how the ADP report can be deceptive when using it to try to predict the BLS report.  The ADP counts payrolls not people and jobs.  One person with three part-time jobs can look like three “new” jobs even though only one worker is employed.  The average manufacturing hours worked and wages earned were flat and layoffs were announced that have not hit the numbers yet.

 We keep saying it and it continues to be validated.  Policy matters, and these are bad.   Sometimes it’s no fun to be right.    

Thanks for reading and, please, stay tuned…

Release Site: www.bls.gov

Every effort is made to ensure accuracy of data transcription but accuracy cannot be guaranteed.  The official release site should be cross referenced.  The analysis represents the opinion of Blue World Asset Managers, Ltd. who does not warrant or guarantee predictions based on its analysis.

© Blue World Asset Managers, LTD Friday, October 07, 2011

Blue World Employment Situation Report Analysis September 2 2011

Blue World Employment Situation Report Analysis

Release Date:  Usually the first Friday of each month

Release Site: www.bls.gov

Market Sensitivity: VERY HIGH

Management Value: VERY HIGH

Friday, September 02, 2011

Brain surgery is not rocket science to a brain surgeon©

Mr. Obama’s jobs plan better be a jobs plan that includes excluding the government from any further “help.”  We already know we are going to hear about “stimulus” without calling it “stimulus.”  We are going to hear about “shovel-ready” without calling it “shovel-ready.”  We are going to hear about infrastructure, green, tax credits for hiring, etc.  The content of this jobs address has already been leaked and, unless you suffer from Alzheimer’s, the ideas being touted as new are not new.  In all fairness we can at least say euphemistic renovation of politically toxic buzz words won’t do any harm.  The fear must be that the proposed double-down will get implemented.  This is no longer theory, friends.  We have the original forecasts recorded.  We have a data pool deep enough for analysis and that analysis exposes unmistakable trends.  Those trends are bad. 

We don’t care what works as long as it works.  By “works” we mean an economy that is in aggressive growth mode with rising GDP, falling unemployment, increased productivity, increasing personal wealth and ever-rising optimism and morale that encourages an environment driven by personal responsibility and motivated by the idea that reward will be determined by effort.  In spite of some “experts'” proclamations to the contrary we have concluded that government spending and extended unemployment benefits will not promote those objectives.  We also maintain the administration’s definition of “works” differs from ours.

The Devil is always in the details.  We can begin with the downward revision of last month’s job gains.  The headliner rate remained at 9.1%.   The number of new jobs added; zero.  That means none lost (net) either.  Already some “experts” are saying “that’s great”, “it got no worse”, “we’re obviously turning the corner” and similar nonsense.  We’ve been reading this report for a long time, folks, and we’ve never seen “0” at the end of that table.  That, alone, is unsettling.  There are, however, some noteworthy and ominous signs in the numbers.  Those over 25 with a Bachelor’s and higher remain at a staggering 4.3%.  Black workers’ unemployed rate jumped .8% overall with black men 20+ posting  a horrifying full 1% jobless rate increase from 17% to 18% July to August.  Those numbers are bad enough.  The most concerning to us is the following: Goods producing, construction, manufacturing, retail and I.T. all posted net job losses. That has not happened in a long time.  In addition, the number of hours worked per week and the hourly rate of pay had been on a long, steady, albeit, uninspiring rise.  They both fell in August.   

 Businesses should not and will not hire while under a dark cloud of government animosity, regulatory uncertainty, high unemployment, tanking consumer confidence and deplorable demand conditions.  A $20k per year employee costs a business double that to employ.  No competent business manager is going to think a $2500 offset to a $40k loss is an incentive to hire.  Only a forecast of improving demand is an incentive to hire.  The government produces nothing, brings nothing to market and is not dependent on customer satisfaction for survival.  Many in government seem to think the private sector works the same way.  Hint:  It doesn’t.

If you missed our post on The Confusion Suffered by “Experts” the link is below.  It describes some reasons why so many headlines contain words like “surprised”, “unexpected” “shocked”, etc.

 http://owl.li/6jNBf

 For us, our clients and our readers we remain defensive with our market investments and do not anticipate a change in that posture in the absence of any evidence of significant policy change. 

 Thanks for reading and, please, stay tuned…

 Release Site: www.bls.gov

Every effort is made to ensure accuracy of data transcription but accuracy cannot be guaranteed.  The official release site should be cross referenced.  The analysis represents the opinion of Blue World Asset Managers, Ltd. who does not warrant or guarantee predictions based on its analysis.

©Blue World Asset Managers, LTD Friday, September 02, 2011