Blue World Economic Index® for October 2015

Brief Explanation

Blue World Economic Index™

Released Monday, November 02, 2015 for October 2015

The Blue World Economic Index™ came in lower for October 2015 at -.21, down from .02 in September.  Some trend downgrades and new report coverage (TD Ameritrade IMX) contributed to the downward move.  In an unusual event, all 8 of the major categories declined since last month. The most surprising were Real Estate and Services. Real Estate, while still positive fell from .43 to .19 and Services fell from .45 to barely positive at .01.  These two had been among the better performing categories over the last year.

October 2015 Graph


Every effort is made to ensure accuracy of data transcription but accuracy cannot be guaranteed.  The official release sites should be cross referenced.  The analysis represents the opinion of Blue World Asset Managers, Ltd. who does not warrant or guarantee predictions based on its analysis.

©Blue World Asset Managers, LTD Monday, November 02, 2015

Blue World Jobs Report Analysis 10/2/2015

Blue World Employment Situation Report Analysis

Release Date:  Usually the first Friday of each month

Release Site: www.bls.gov

Market Impact: VERY HIGH

Management Value: CRITICAL

Friday, October 02, 2015

pinnochio

Last month some moron at the Fed suggested that at 5.1% unemployment the nation was near full employment and a rate hike was on track for September! Pinocchio must have left motivational speaking and headed over to the Fed.  Our apologies to inanimate, wooden puppets.  We did not mean to suggest you are stupid enough to work for the Fed…

The following contains graphic statistics and strong language that may be too intense for some managers. Business leader discretion is advised. 

We’re afraid it’s even worse than it looks.  Weak numbers from the prior two months were revised down by 59k.  That’s bad enough, but the private sector numbers came down 69k.  The private sector total for September 2015 was only 118k.  The labor force hemorrhaged another 350k potential workers, and the Not in Labor Force statistic exploded by an unbelievable 579k driving the number of unemployed Americans to more than 94.6M, cratering an already record low participation rate from 62.6 to 62.4!

Wages pulled back.  The work week got shorter, and the diffusion index for all industries fell to a precarious 52.9 (50+ indicates expansion.) In addition, manufacturing fell spectacularly into contraction over the last 2 months.

Meanwhile, our esteemed administration is pursuing EPA and tax policy that will further cripple the economy, while Russian bombers are hitting Syria and telling the U.S. to leave the region, as our President lectures us on domestic gun control referring to himself over 28 times in a speech about the tragedy in Oregon…

Full employment?  Rate hike?  International respect of America?  Only in a fairy tale, my friends.

Thanks for reading and, please, stay tuned…

Release Site: www.bls.gov


Every effort is made to ensure accuracy of data transcription but accuracy cannot be guaranteed.  The official release site should be cross referenced.  The analysis represents the opinion of Blue World Asset Managers, Ltd. who does not warrant or guarantee predictions based on its analysis.
©Blue World Asset Managers, LTD Friday, October 02, 2015

Blue World Economic Index® for August 2015

Brief Explanation

Blue World Economic Index™ 

Released Monday, August 31, 2015 for August 2015

The Blue World Economic Index™ remains fractionally negative for August 2015 at -.06.vs a -.14 in July. Three out of the eight major categories were negative including Employment, Inflation and Manufacturing while Real Estate made it back above zero for the month joining General and Consumer measures, Services and Retail Sales.

We’ve been asked why Inflation is receiving a “negative” index assignment when it is so low.  It is true that rising inflation can be the enemy of growth but when it runs too low for too long it is more an indication of weak demand as has been the case now for several years.  We don’t want to see run-away inflation develop but some steady pricing pressure to indicate growing demand would be a welcome change.

We continue to believe a rate hike is not imminent and the Fed will require a great deal more evidence of strengthening.

August 2015 Composite Graph


Every effort is made to ensure accuracy of data transcription but accuracy cannot be guaranteed.  The official release sites should be cross referenced.  The analysis represents the opinion of Blue World Asset Managers, Ltd. who does not warrant or guarantee predictions based on its analysis.
©Blue World Asset Managers, LTD Monday, August 31, 2015

Blue World Jobs Report Analysis 08-07-2015

Blue World Employment Situation Report Analysis
Release Date: Usually the first Friday of each month
Release Site: www.bls.gov
Market Impact: VERY HIGH
Management Value: CRITICAL
Friday, August 07, 2015

Brain surgery is not rocket science to a brain surgeon©

The markets don’t like the headline at time of writing, and there could be a few reasons. They might perceive the headlines to be a positive for the economy (which should obviously cause the markets to fall) and think it makes a rate hike more likely. They might think it’s a negative, and therefore signaling a still weak economy. They may view it as good enough to make a rate hike likely but bad enough to signal continued weakness…ughhh. The psychology of the “experts” is an endless exercise in intellectual masturbation. For those of us running real businesses and trying to employ real people there is no indication of significant change in either direction. The labor market remains weak and our decisions must remain cautious.

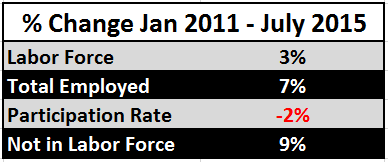
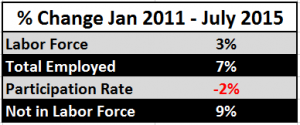
The unemployment rate is unchanged at a fraudulently low 5.3%. We’ve been explaining that this is caused by a phenomenon where the number of employed people is rising much faster than the number of those entering/re-entering the civilian labor force. We’ve shown that graph over and over, but we decided to take a different approach today. We are posting a table showing the percent changes in some key metrics since January of 2011. We admit even we were startled at the results.

Before we get to that…215k net new hires are reported at the headline with touted upward revisions to May and June of 2015. A closer look shows those revisions total only +14k. The private sector, however, reports only 210k net and only +6k in revisions, the balance coming from additions to government payrolls. Average hours worked remain range bound, those not in the labor force rose nearly 150k, with increases to those marginally attached to the labor force and total discouraged workers leaving more than 97.7 million Americans out of work. The Participation Rate remains at the all-time “recovery” record low of 62.6%

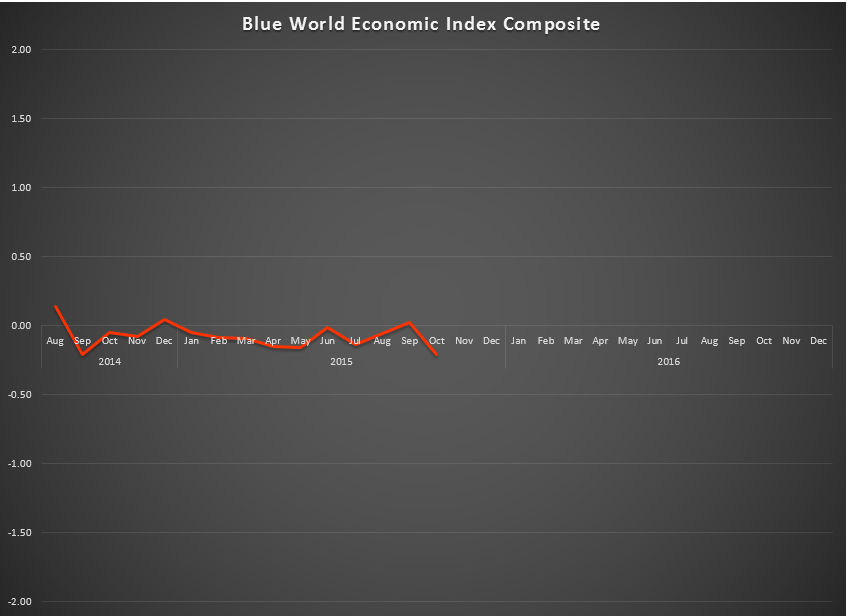
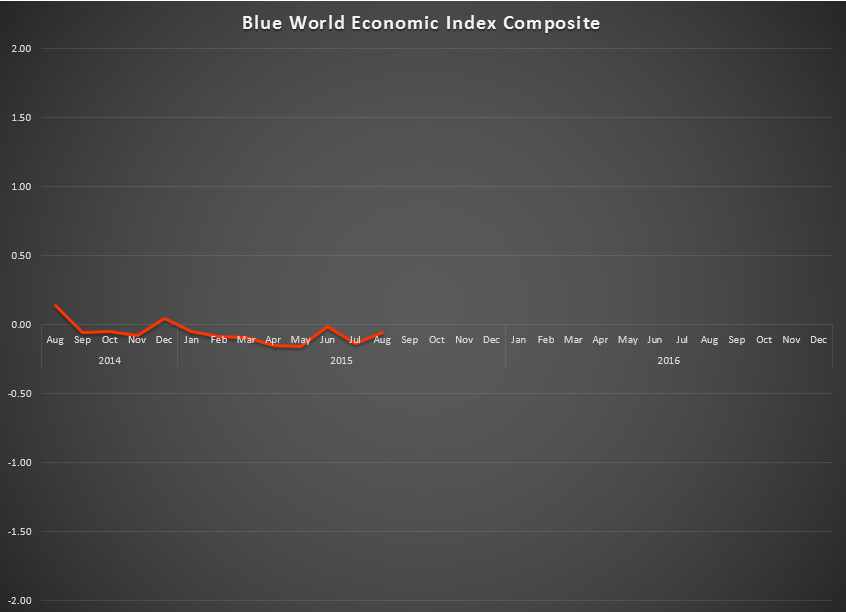
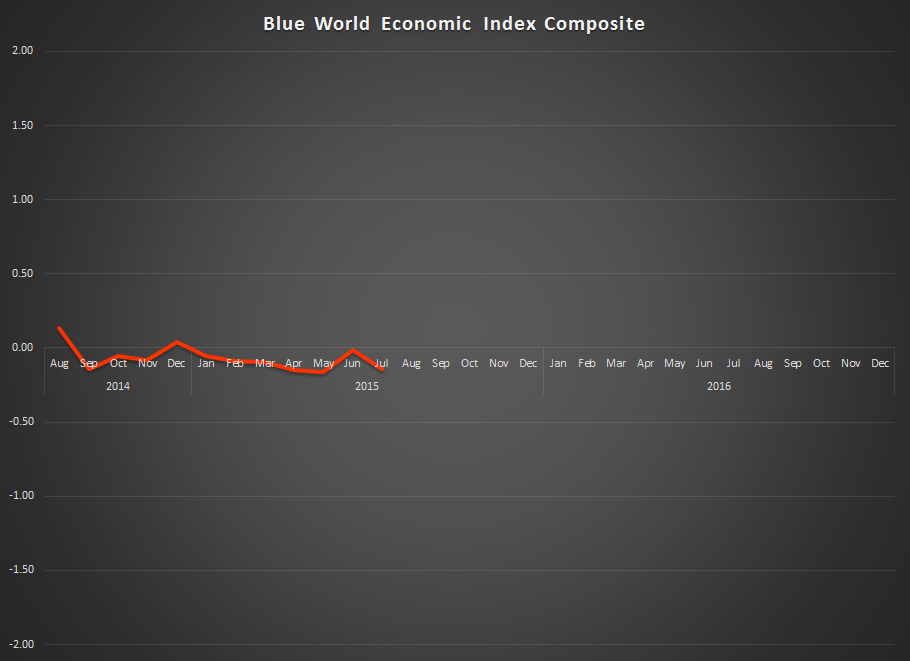
A couple of positives did show up for July of 2015, including some spotty bounce-back in sector wages and a strong diffusion index in manufacturing at 57.5. Unfortunately the latter is in disagreement with most manufacturing sector data from the past year, so let’s hope it signals an uptick in other manufacturing data going forward. Follow the Blue World Economic Index™ for more information.

Below is the table we mentioned showing percent changes in a few key metrics followed by Blue World as well as the Fed as they consider monetary policy. The weakness is striking and may illustrate why the unemployment rate is so misleading even better than the graphs.

Table July 2015

The next jobs report release is scheduled for Friday, September 4th. Our written report will be out in the morning and Matt will be analyzing it live on WBBM Chicago AM780 and 105.9FM at about 12:10 Central. Look for the next Blue World Economic Index™ report on Monday, August 31st.

Have a great month, everyone.

Thanks for reading and, please, stay tuned…

Release Site: www.bls.gov

Every effort is made to ensure accuracy of data transcription but accuracy cannot be guaranteed. The official release site should be cross referenced. The analysis represents the opinion of Blue World Asset Managers, Ltd. who does not warrant or guarantee predictions based on its analysis.
©Blue World Asset Managers, LTD Friday, August 07, 2015

The Blue World Economic Index® for July 2015

Brief Explanation


The Blue World Economic Index™  for July 2015   – .14

The Blue World Economic Index dipped more negative in July ’15 continuing its meander around zero.  4 out of the 8 major categories were in the negative including Employment, Inflation, Manufacturing, and surprisingly Real Estate with Employment being the weakest at – .93.  Consumer measures lead the plus column at .38, but that is down a sizable .36 from last month.  General measures, Retail, and Services were also fractionally positive.

The Blue World Jobs Report Analysis will be out next Friday.

 7-15 Graph

Every effort is made to ensure accuracy of data transcription but accuracy cannot be guaranteed.  The official release sites should be cross referenced.  The analysis represents the opinion of Blue World Asset Managers, Ltd. who does not warrant or guarantee predictions based on its analysis.
©Blue World Asset Managers, LTD Friday, July 31, 2015