Blue World Jobs Report Analysis 04-01-2016

Blue World Employment Situation Report Analysis

Release Date: Usually on the first Friday of the month

Release Site: www.bls.gov

Market Impact: Usually Very High

Management Value: Critical

Friday, April 01, 2016

Brain Surgery is not Rocket Science to a Brain Surgeon©

Part Rate 3-16


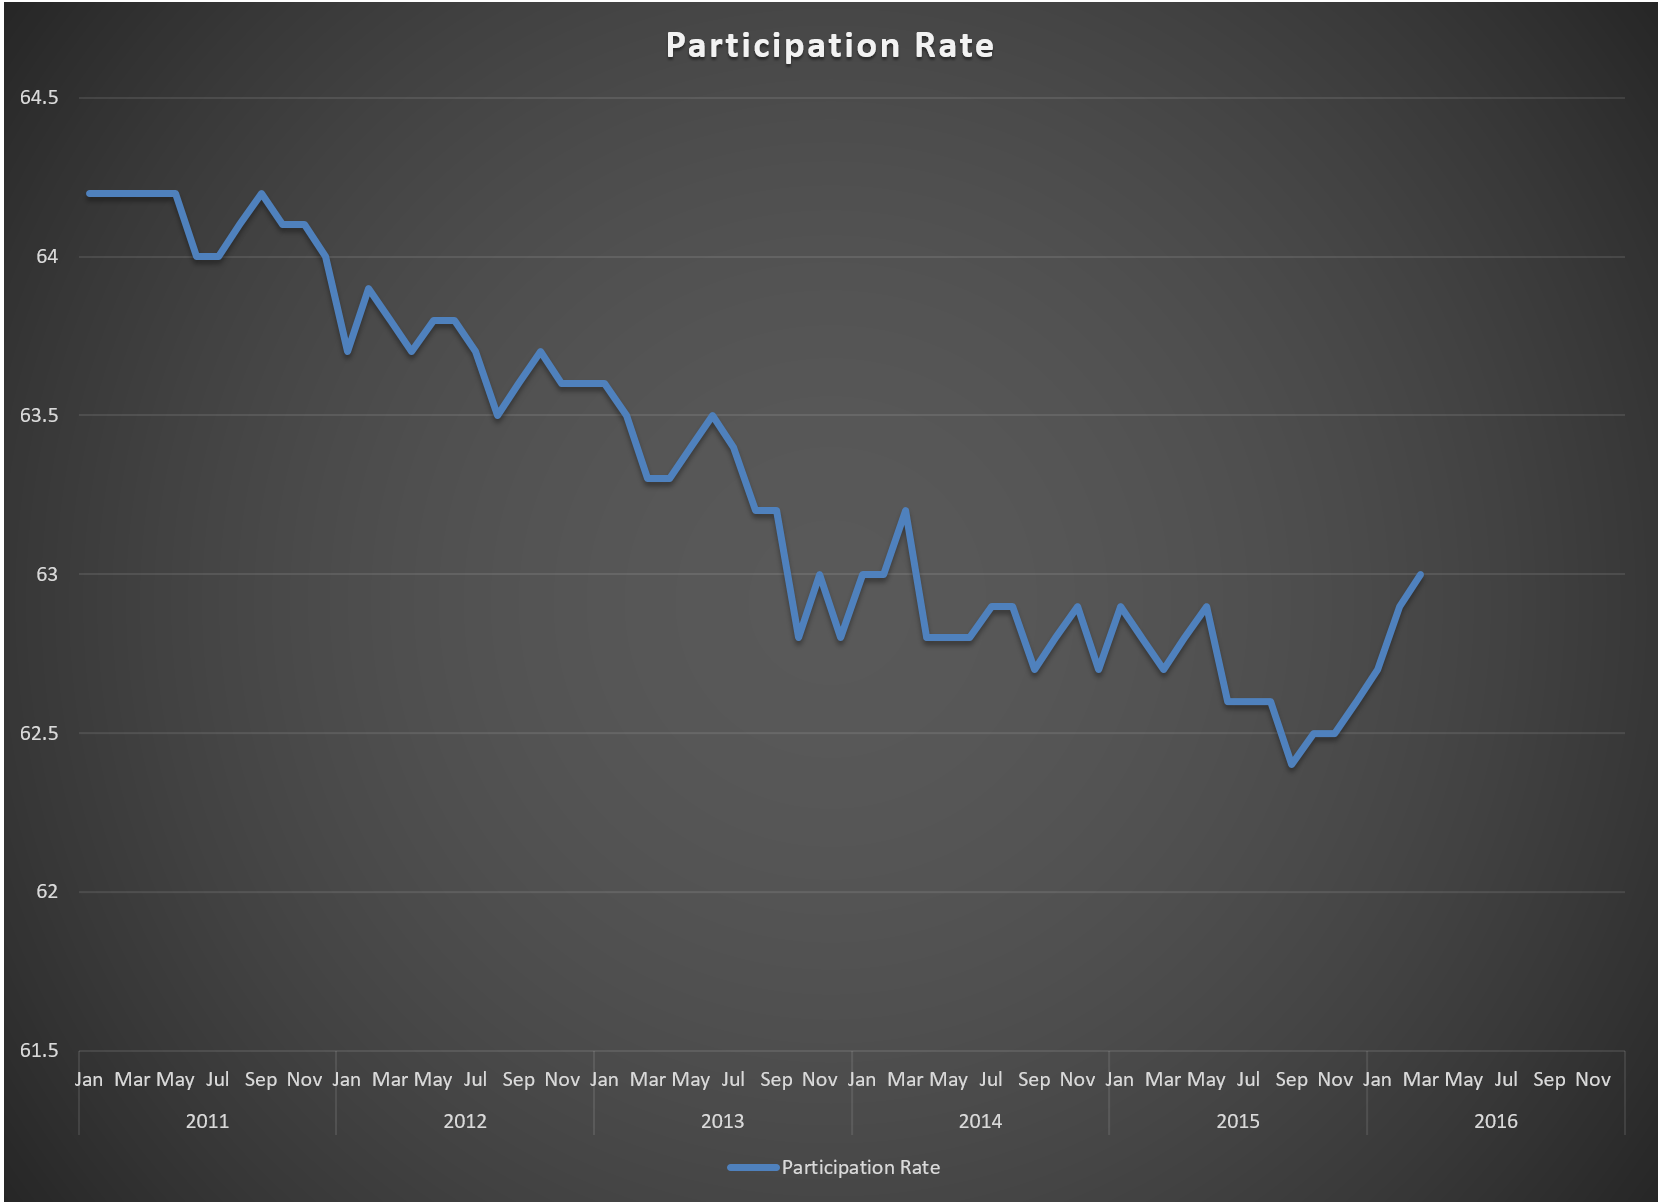
Mixed again but leaning cautionary for March of 2016.  Let’s start with the positives.  The Labor Force and Participation Rate increased, the Not in Labor Force total decreased and pay recovered from last month’s backtrack. We don’t need to keep explaining the phenomena that makes the Unemployment Rate irrelevant, but we can’t help but point out the 0.1 percent rise to 5% is actually an indication of some strength due to the upward trending Participation Rate.

On the downside the Work Week remained flat for the non-farm population but pulled back in both construction and manufacturing, whose diffusion index has lost 20 points in the first quarter falling to 37.3. That’s really bad.  The real concern, however, is hiding behind the headline of 215k net jobs.  Revisions to the first two months of the quarter so far netted a largely insignificant -1k.  The problem is in the private vs. public sectors.  March saw a net 20k in government hires, leaving the private sector picking up only 195k.  The average for 2015 was net 222k hires per month in the private sector.  Q1 of 2016 is sporting an average of only 195k.

This report typically issues on the first Friday of the month.  They will often delay for a week when the first Friday also happens to be the first of the month but not this time. Not only is it the first of the month, but it is also quarter end. Respondents, especially businesses, have higher priority internal undertakings than the timely reply to surveys.  That leads us to look for potentially larger revisions to March 2016 over the next couple of months as more complete data makes its way home.

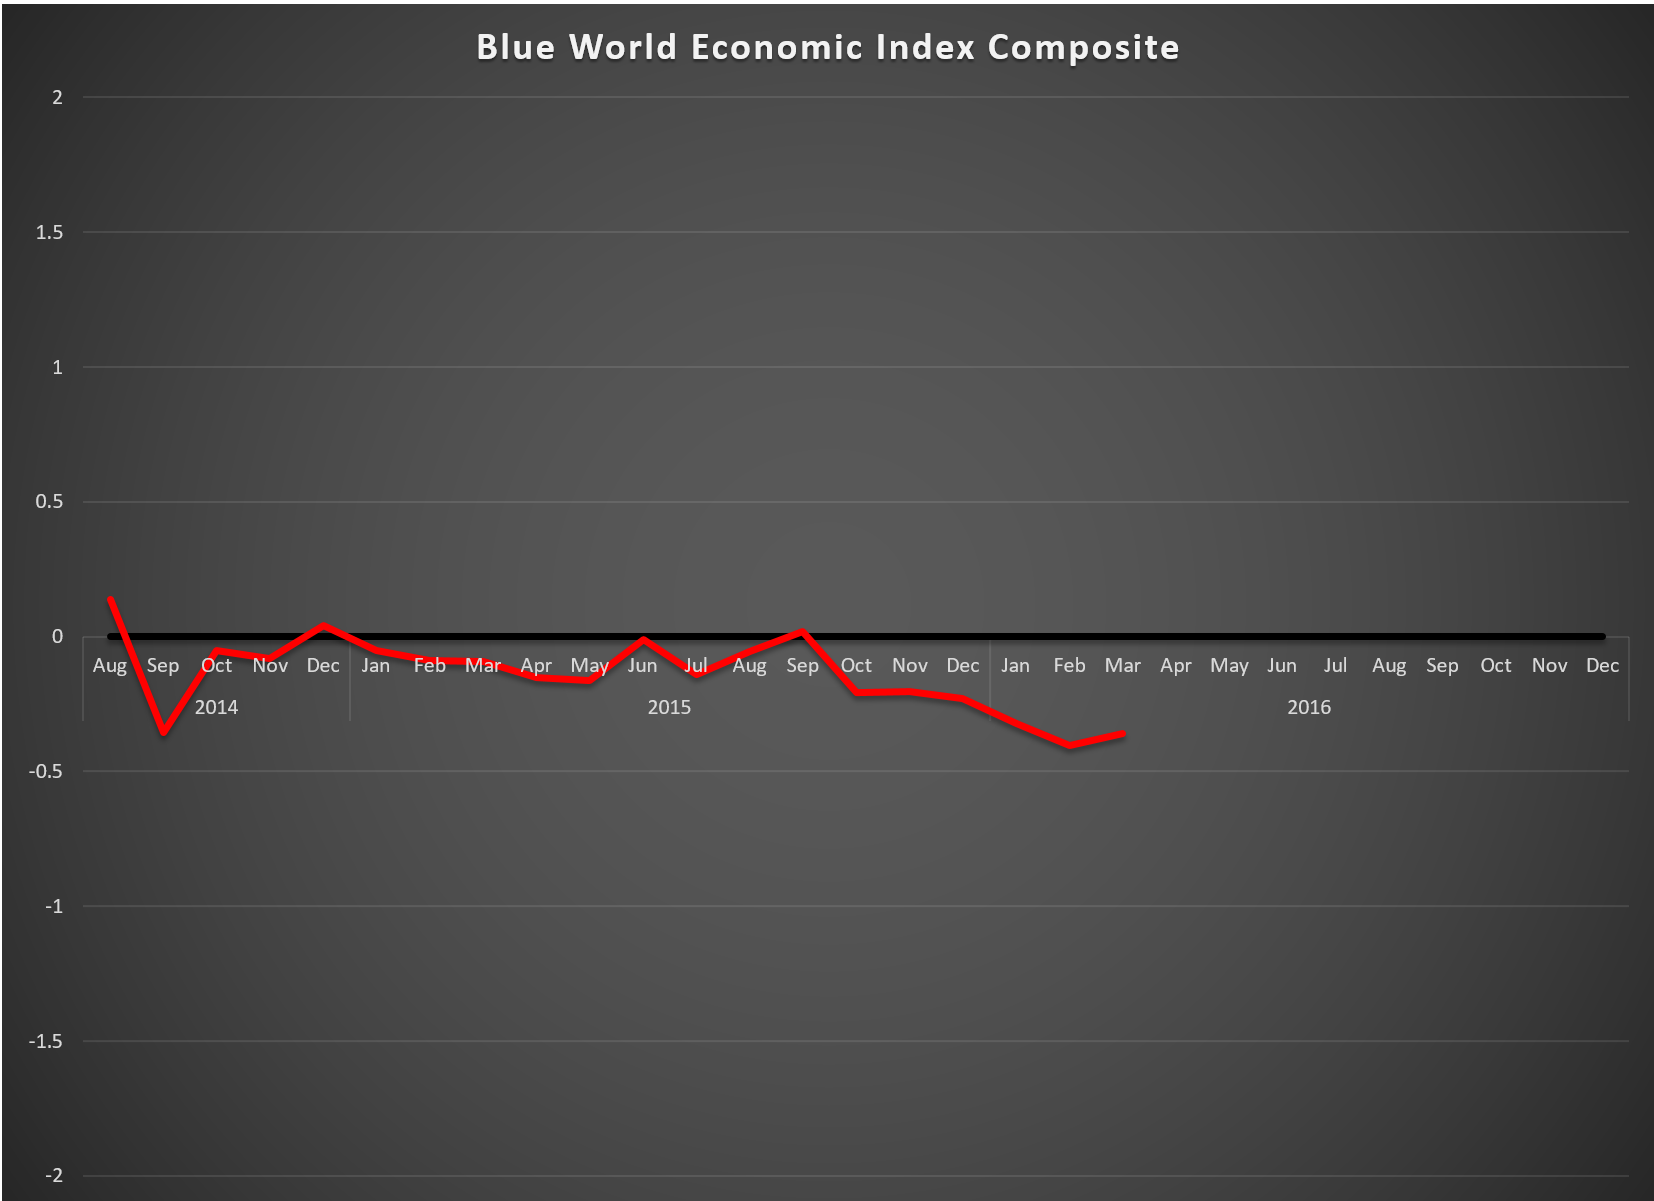
What about the Fed? There is ammunition here for the Doves and Hawks. You can spin this one for strength or weakness, hence our actionable management intelligence characterization of “mixed.” Ultimately there is not enough here for a rate hike, and watching the Fed’s Labor Market Conditions Index on Monday will be important, although we don’t expect any huge move in either direction.  That said, we see the Fed holding pat. Apparently, so does Ms. Yellen following her dovish leanings yesterday. The Blue World Economic Index™ for March 2016 supports the doves.

Have a great month. Thanks for reading, and please stay tuned…

Release Site: www.bls.gov

Every effort is made to ensure accuracy of data transcription but accuracy cannot be guaranteed.  The official release site should be cross referenced. The analysis represents the opinion of Blue World Asset Managers, LTD. who does not warrant or guarantee predictions based on its analysis. 
©Blue World Asset Managers, LTD Friday, April 01, 2016

Blue World Economic Index® for March 2016

Brief Explanation

Blue World Economic Index™

Scale: -2 to +2

Release Date:  Usually the first Business Day of Each Month

Release Site: www.blueworldassetmanagers.com

Management Value: Critical

Thursday, March 31, 2016

CmpGrp316

The BWEI posted a fractional gain of .05, improving from -.40 to -.35 for March 2016 which, obviously, only means less negative. Of the eight major sectors, six remain in negative territory.  Those include General Measures, Employment, Inflation, Retail, and Services.  There was notable improvement in Manufacturing, which interrupted its recent freefall improving .15 from -.82 to -.67. Difficulty in Retail was corroborated by the Challenger Job Cut report this morning showing the retail sector leading the way in announced mass layoffs, overtaking the energy sector for the month, but the real Retail demon in the dark has been the monthly Inventories reports showing a chilling trend in the I/S ratio. Anyone who constitutes a link anywhere in the supply chain would do well to review the most recent six to twelve releases.

The two sectors remaining positive were Consumer Measures and Real Estate. However, the Consumer total lost ground, and Real Estate remained flat at .10 after a very mixed month where five out of the nine followed reports averaged in at negative values.

What’s the Fed going to do? We say nothing. If you’re listening closely you’ll hear the word “recession” creeping into the media, but you’re not unprepared if you’ve been following us and that’s the point of our existence!

Don’t miss the Blue World Jobs Report Analysis out tomorrow morning, and Matt will be discussing it live on WBBM AM780 and 105.9FM in Chicago at 12:09CST.  Those outside of market can find the podcast at CBS Chicago later in the day.

Have a prosperous April and thanks for reading!

Every effort is made to ensure accuracy of data transcription but accuracy cannot be guaranteed.  The official release sites should be cross referenced.  The index assignments represent the opinion of Blue World Asset Managers, Ltd. who does not warrant or guarantee predictions based on the index.
©Blue World Asset Managers, LTD Thursday, March 31, 2016

Blue World Economic Index® for February 2016


Brief Explanation

Blue World Economic Index™

Released Monday, February 29, 2016 for February 2016

2 Feb Graph 2016


February was not a good month for the U.S. economy according to the Blue World Economic Index™ composite, which settled at -.40 which is .08  lower than January.  Of the eight major categories, six were negative including General, Employment, Inflation, Retail, Services, and Manufacturing.  Real Estate broke dead even at 0.0, with Consumer measures remaining level and positive at .2.  In spite of all that, there were a couple of late reporting bright spots that may hint at a better March.  There were some notable conflicting data sets this month with Durable Goods and Industrial Production posting unexpectedly strong gains, which lifted Manufacturing to close the month fractionally higher than January even though it had fallen sharply at mid-month.  Of the twelve Manufacturing reports the index follows, including the Regional Fed reports, they were two of only three positive readings.  Let’s hope that starts a trend.  Some authors have suggested that the Personal Income and Consumption data are in conflict between their individual readings and the GDP figures, which both posted Friday the 26th.  We have to remember, however, that the GDP report reflects the 2nd revision to Q4 2015, meaning they are lagging while the Personal Income and Outlays report is current for January 2016.  That said, the upward revision to GDP appears to be on the back of unwanted inventory build, and we’ve spent way too much time below 3%.   Personal Income and Outlays, however, did hint strongly at optimism for a better March.  Let’s hope that materializes.

Don’t miss the Blue World Jobs Report Analysis this Friday the 4th.

Every effort is made to ensure accuracy of data transcription but accuracy cannot be guaranteed.  The official release sites should be cross referenced.  The analysis represents the opinion of Blue World Asset Managers, Ltd. who does not warrant or guarantee predictions based on its analysis.
©Blue World Asset Managers, LTD Monday, February 29, 2016

Blue World Jobs Report Analysis 2-5-2016

Blue World Employment Situation Report Analysis

Release Date:  Usually the first Friday of each month

Release Site: www.bls.gov

Market Impact: VERY HIGH

Management Value: CRITICAL

Friday, February 05, 2016

Brain Surgery is not Rocket Science to a Brain Surgeon©

An odd twist!  Usually we have what appears to be a respectable number at the headline and much weaker indications in the detail.  This month, and we can’t remember another, the opposite is true.  We’re not saying the underlying is stellar. In fact it’s rather flat but compared to what we expected it was a pleasant surprise.

The headline says 151k.  It’s actually 158k for the private sector, as the government shed 7k jobs in January.  There was a slight uptick in the participation rate which, while still ridiculously low, is on a 2 month “winning streak.”  The quotes are because we were deriding the number a year ago and this is .2 below that, but up is up!  The labor force was essentially even, the number of those unemployed fell slightly, as did the number of those not in the labor force so all in all we’ll call it flat.  After wincing at the headline this morning, we’ll take it.

Points of concern…

While the data was better than we expected, there is some concern over discrepancies with other reports out over the month.  We won’t go through all of it but an example is manufacturing.  The Blue World Economic Index™ was published on Monday of this week, and Manufacturing set a record low for the sector and the index at -.91.  As of this morning it sits at -.98 and nothing points to any good news there, yet today’s job report shows healthy gains in all three subdivisions, durable, non-durable, and motor vehicle parts.  Motor vehicle parts is the only one that makes any sense at all.  So there are some things that don’t necessarily line up, but that happens occasionally, and they usually come back in line.

We keep fielding questions about the Fed, and we definitely feel they are suffering from “hiker’s remorse.”  The markets are tanking, the economy is slowing, and there is a lot of talk of recession lately.  All of that said we will, of course, monitor and evaluate month by month, but right now we’re pretty comfortable thinking there will be no further hikes in 2016.  We certainly wouldn’t advise any, but they haven’t asked us…yet!


Thanks for reading and, please, stay tuned…


Release Site: www.bls.gov

Every effort is made to ensure accuracy of data transcription but accuracy cannot be guaranteed.  The official release site should be cross referenced.  The analysis represents the opinion of Blue World Asset Managers, Ltd. who does not warrant or guarantee predictions based on its analysis.
©Blue World Asset Managers, LTD Friday, February 05, 2016

Blue World Economic Index™ for January 2016

Brief Explanation


Blue World Economic Index™

Released Monday, February 01, 2016 for January 2016

January was not a very good month for the economy according to the Blue World Economic Index™ which posted its worst showing since we began publishing it publicly in 2014.

The composite index came in at -.32 with deterioration in all but two (Employment and General) major categories. Manufacturing continues to get thumped and is the most notable negative at -.91, a reading we have not seen since the inception of the index.

While there is food for both hawks and doves in the individual reports, overall we are showing an economy that was, in our opinion, not ready for the rate hike and certainly not ready for more.  There is, of course, a growing chorus of voices joining our assessment in the financial media.  Let’s hope for a better February.

Watch for the Blue World Jobs Report Analysis which will be out this Friday.

Every effort is made to ensure accuracy of data transcription but accuracy cannot be guaranteed.  The official release sites should be cross referenced.  The analysis represents the opinion of Blue World Asset Managers, Ltd. who does not warrant or guarantee predictions based on its analysis.
©Blue World Asset Managers, LTD Monday, February 01, 2016