Blue World Employment Situation Analysis 8-3-2012

Blue World Employment Situation Report Analysis

Release Date:  Usually the first Friday of each month
Release Site: www.bls.gov
Market Sensitivity: VERY HIGH
Management Value: VERY HIGH
Friday, August 03, 2012

Brain surgery is not rocket science to a brain surgeon©

163,000 new jobs vs. 100,000 expected!  WOO HOO, right?  Sorry folks, this report is the cap on a miserable month of data.  Why?  Here we go…

In the winter and spring we explained ad nauseum that the falling unemployment rate was an artificial improvement in the labor picture because we can’t make the labor market better by making the labor force smaller.  The uptick in the last couple of months is an indication of a deteriorating market but, as always, the details not the headlines tell us why: 

The Establishment Survey indicates 163,000 payrolls were added last month.  The problem is that the size of the labor force fell by 150,000 workers, the  number of those not in the labor force rose by 348,000, the number of employed people fell by 195,000 and, wait for it, the number of unemployed people rose by 45,000.  I’m afraid this just doesn’t make for a good report but, of course, there’s more.  25 years old and up with a Bachelor’s Degree or higher remain unemployed at over 4%.  The work week length, and consequently, overtime hours are not increasing and wage increases still lag inflation.

Other data for the month show GDP at a very weak 1.5%, which falls to 1.3% when we strip out inventories.  The regional Fed reports all have a common theme of contracting orders and evaporating inventories validated by a dismal factory orders report .  Productivity is down, unit labor costs are up, consumer comfort, confidence and sentiment are trending down, and the FOMC acknowledges the economy is slowing but isn’t ready to “act” yet.

Many institutions out there have an interest in trying to show the data in its most positive or negative light.  Since our job is to help businesses develop strategy based on the realities of the economy, we have to take the data as it is…and the data is negative.

Thanks for reading and, please, stay tuned…

Release Site: www.bls.gov

Every effort is made to ensure accuracy of data transcription but accuracy cannot be guaranteed.  The official release site should be cross referenced.  The analysis represents the opinion of Blue World Asset Managers, Ltd. who does not warrant or guarantee predictions based on its analysis.

©Blue World Asset Managers, LTD Friday, August 03, 2012

Blue World Employment Situation Report Analysis

Release Date:  Usually the first Friday of each month

Release Site: www.bls.gov

Market Sensitivity: VERY HIGH

Management Value: VERY HIGH

Friday, June 01, 2012

Brain surgery is not rocket science to a brain surgeon©


Well, we think this report speaks for itself.  We find it amusing that the government summary described the unemployment rate as “essentially unchanged.”  When it drops by a tenth that’s an improvement.  When it rises a tenth that, apparently, is “essentially unchanged.”


Wages were flat and actually down a bit in areas like manufacturing, leisure/hospitality and utilities.  The much bigger concern when added to that is the reduction in the length of the work week in manufacturing and construction with manufacturing overtime hours remaining in a narrow range between 3.1 and 3.3 hours per week.  These are all well below any levels that could presage more hiring.  We think that’s as deep as we need go in a report that speaks for itself.


Let’s spend a minute addressing the “why” such poor results are being reported.  We can’t say it enough.  Policy matters and these don’t work.  Businesses are doing exactly what you and I would do in uncertain times.  They would conserve cash, reduce spending to the bare essentials and wait for a clearer picture.  Why are times uncertain?  Because no one knows what Congress is going to do with the tax code before year end, the fate of Obama Care is unknown, an upcoming election could perpetuate or totally reverse current anti-capitalistic policy and, oh yeah, Europe is trying really hard to implode.  If any of this sounds like a recipe for job creation and economic growth to you we have some real estate we’d like to offer you!


Policy matters, folks, and these don’t work.


Thanks for reading and, please, stay tuned…


Release Site: www.bls.gov


Every effort is made to ensure accuracy of data transcription but accuracy cannot be guaranteed.  The official release site should be cross referenced.  The analysis represents the opinion of Blue World Asset Managers, Ltd. who does not warrant or guarantee predictions based on its analysis.

©Blue World Asset Managers, LTD Friday, June 01, 2012

Blue World Employment Situation Report Analysis – May 4, 2012

Blue World Employment Situation Report Analysis

Release Date:  Usually the first Friday of each month

Release Site: www.bls.gov

Market Sensitivity: VERY HIGH

Management Value: VERY HIGH 

Friday, May 04, 2012 

Brain surgery is not rocket science to a brain surgeon© 

Gotta love those “experts!”  There was a big miss, bigger than usual, on the new jobs estimates put forth by the economist community.  We should all be used to the surprises when the actual data comes out i.e. no longer a surprise.

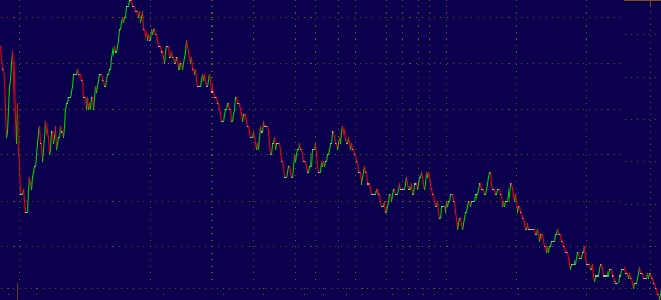
If you’ve got a little time on your hands you can engage in one of our favorite amusements.  That is, watching the markets as the jobs report is released.  Pull up an intra-day futures chart and you’ll be able to spot the pre release jitters, the identification of the reduced unemployment rate, the realization that the number of new jobs forecast fell well below expectations and, finally, the beginning of the read of the detail.  Oh, what the heck…hold on and I’ll grab a chart.

The report is released at 7:30a CDT.  The chart starts at 7:28a CDT courtesy Ameritrade’s think-or-swim site.  The down trend continued through time of publishing at about 1:15p CDT.

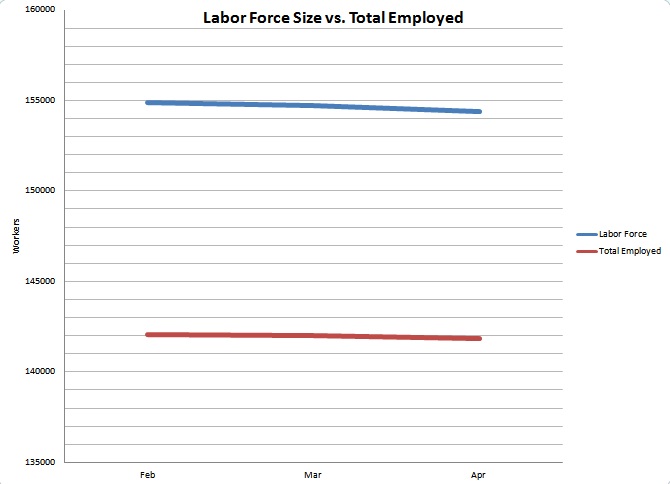
While the rate is down to 8.1% our quick review of articles out there proves that even the “experts” have caught on to simple math.  Heck, there is an article in the Journal entitled Why Did the Unemployment Rate Drop?  It actually does a good job explaining what we’ve been saying throughout this artificial decline in the unemployment rate.  If you’re new to our blog you can see a full explanation of this in our post Why Does Blue World Keep Saying the Labor Market is not Improving? at http://owl.li/aHzYx   The short explanation is that the number of employed people has been rising while the number of people reporting as members of the available labor force has been falling.  As we keep saying, you can’t improve the labor market by making it smaller.  This month there is an even more troubling trend developing.  The graph below based on data from www.bls.gov, will show that the number of employed people actually fell for the first time in many months.  Considering recent trends that should have kept the rate stable.  The trouble is that the labor force shrank by a larger magnitude than the drop in the number of employed people!  That’s a very disturbing trend we would not like to see continue.

Wage increases, plus changes in weekly hours and overtime are thoroughly underwhelming.  In fact, a deep dive into the data showed a backwards move in some of these key categories for production and non-supervisory workers in manufacturing and construction.  Even though inflation was down a couple of tenths, the earnings are still pathetically behind and that does not bode well for consumer spending.

There were notable up-ticks in areas where we don’t want to see up-ticks, such as the number of people at work part time for economic reasons, including slack work conditions and could only find part time work.  Marginally attached to the work force and discouraged workers were up.  That’s no surprise after seeing the overall labor force size decline on the first page.  A little-known statistic that we mention occasionally is Job Leavers.  These are workers who voluntarily leave their jobs before having another one lined up because they’re confident they can find other work when they want to.  While always quite volatile month to month, the decrease in their totals for April was dramatic enough to mention today.

In other data we continue to see productivity fall while unit labor costs rise.  Services declined in April, and that is disturbing at any time, but a spring decline is a departure from traditional norms as is the decrease in the labor force size.  If monthly data like this doesn’t provide one with a reliable sense of the quarterly GDP report then nothing will.  We continue to marvel at the shock expressed by so many authors and commentators at last week’s report.  A full explanation can be found at http://owl.li/aHGSG in our post The Confusion Suffered by “Experts” II – GDP April, 2012

Encourage your legislators to read Blue World’s posts!  Try as they might they cannot replace supply with legislation or demand with redistribution.  The laws of economics are simple.  Without demand there is no need for supply.  If there is no need for supply then there is no need to keep the work force you had, much less hire new employees.  If people aren’t working they don’t have buying power.  Now we are full circle to no buying power leaves us without demand.  Anyone who tries to make it more complicated than that may be any combination of ignorant, dishonest or, of course, an “expert!”

Investors, managers, entrepreneurs and business owners may do well to keep the defense on the field for the foreseeable future.

Thanks for reading and, please, stay tuned…

Release Site: www.bls.gov

Every effort is made to ensure accuracy of data transcription but accuracy cannot be guaranteed.  The official release site should be cross referenced.  The analysis represents the opinion of Blue World Asset Managers, Ltd. who does not warrant or guarantee predictions based on its analysis.

©Blue World Asset Managers, LTD Friday, May 04, 2012

The Confusion Suffered by “Experts” II – GDP April, 2012

Friday, April 27, 2012

Ignorance is curable. Stupid is forever.©

The Confusion Suffered by “Experts” II – GDP April, 2012

As our regular followers know we don’t usually do a post to analyze the GDP report in detail, because if we follow the monthly BLS Unemployment Report (www.bls.gov) the GDP is old news.  All the data we need to predict GDP (at least to an accuracy of worse, flat, better) can be found in the jobs data.  While today is no exception to the “no need to scrutinize” rule, we did feel a sense of obligation to comment on it due to the significant “unexpected” results reported today.  As we talked about today’s release it became apparent that what we had was a sequel to our post The Confusion Suffered by “Experts” from August, 2011.  It would be very helpful to review that post now so here’s the link. http://owl.li/ayFhe

Whenever we write experts in quotes you may assume we are saying the group or individual we are referring to is intellectually bankrupt (that means “moron”, “experts.”)   Why do we exhibit such loathing for the “experts?”  Because their financially or politically motivated spin analysis serves no useful purpose for those who invest real money, employ real people and are responsible for real performance.  In fact, it can lead to conclusions and decisions that are dangerous to a business.  And, of course, in some cases they’re just stupid.

So, why was the GDP report no surprise to us or our readers but was to so many “experts,” including the 85 economists (academics) polled by Bloomberg, for example?  Because they don’t compare what they see in the data of one report to the data published in other reports and view the full body of information through the prism of real life.  There was no defendable evidence that the GDP report was going to spike sharply or tank abruptly.  We predicted a flat to shallow downward move from Q4 ’11 and that’s what we got.  Kudos to those “experts” who also got it right.

The Confusion Suffered by Experts, referenced above, explains when and why some data releases lose their predictive value under certain macro conditions of the economy and, consequently, why it’s so silly to have wild market reactions to weekly data like first time unemployment insurance claims.

The Gross Domestic Product Report

We don’t need an in-depth tutorial on how to read the GDP report in order to follow this trail.  All we need to know is that there are 4 marquee headings that contribute to overall Gross Domestic Product.  They are:

  • Personal Consumption Expenditures
    • the total of what consumers spent
      • consumer spending is 70% of our economy
  • Gross Private Domestic Investment
    • the total of what private sector businesses spend on fixed assets
      • buildings, equipment, etc.
  • Net Exports
    • the net difference in value between what the U.S. sells and buys from other countries
      • Since the 70’s the U.S. virtually always has a trade deficit and that subtracts from total GDP
  • Government Spending
    • total spent by federal, state and local governments

Remember, no single number, data point or report is valuable unto itself.  Trends are what matter.  Here are some examples of the trends that irrefutably predicted an uninspiring GDP report.

There have been three unemployment reports since the last GDP estimate.  The key indicators that we can look at to get a sense of GDP are the following:

  • Total unemployed population
    • This is not the unemployment rate.  The unemployment rate has been very misleading lately.  See why at Why Does Blue World Keep Saying the Labor Market is not Improving http://owl.li/ayLvx
    • The total unemployed rose in one month and fell in another.  Coupled with a similar pattern in the total labor force size suggests an overall flat complexion so that would not predict an uptick in GDP
  • Unemployment Rate of Workers who are 25yoa+ with a Bachelor’s Degree or Higher
    • This group of professional, management, entrepreneurial and big ticket consumer types has been unemployed at rates never seen since records have been kept for nearly 3 years
    • Expansion requires managers, entrepreneurs and big spenders.  When the needle on this demographic is not trending to the right, GDP cannot advance aggressively.
  • Avg. Hours Worked per Week in Manufacturing
    • The number of hours worked in a week across the manufacturing sector is a major indicator of demand and, therefore, a great predictor of GDP.
    • In the last three months the most optimistic read is a flat work-week length.  This does not suggest GDP growth
  • Avg. Overtime Hours Worked per Week in Manufacturing
    • For corroboration and predictive analysis we review the need for Overtime Hours in manufacturing.  Even if the work week length is flat, if overtime is trending up it’s a good bet companies will need to start hiring soon.
    • Over the last several months O.T. hours in manufacturing have been completely flat and well below the number needed to presage the need for new workers.  This does not support confidence in GDP growth prospects.
  • Avg. Hours per Week in Construction
    • Flat at best
    • Need we go on?

Those are just a couple of examples of how one report can predict another report which is in stark contrast to the irresponsible reactions to shorter term output described in The Confusion Suffered by “Experts.”

Blue World has opined that recent increases in durable goods spending has been more about deferred expenditures than evidence of a true recovery.  This hypothesis is supported by the durable goods orders report from yesterday (4-26-12) that showed a slowdown of consumer and business spending on items built to last at least three years.  Blue World, therefore, expects a downward revision in that GDP category at the next estimate release on May 31, 2012.

The increase in consumer spending on non-durable goods (clothing, food, etc.) appears right in line with inflation so consumer spending is unimpressive and unconvincing.

Of particular note is the significant drop in business investment for the first quarter.  This, too, signals prior quarter’s strength was more attributable to spending that had been put off during the worst of the recession and just couldn’t wait any longer.

Another line item that we watch closely is the Change in Private Inventories line.  Inventories are goods that were produced but not sold.  They can give pretty good clues about supply and demand.  If inventories are striped out of the 2.2% GDP reported today the GDP growth drops to 1.6%.  We’ll need to watch this over the next two Q1 estimates because the big drop from Q4 inventory’s contribution to the total GDP percent change could signal the deferred expenditure buying spree for consumers and business is over with the jobs data, manufacturing in particular, showing new finished inventory is not being replaced as fast.

Government spending continues to decline and for very understandable reasons.  Remember, the government produces nothing.  Taxes are a levy.  They are not offered voluntarily in exchange for a product or service.  When the private sector suffers government has no choice but to suffer as well because private sector success is government’s only source of revenue.  This is why we keep yelling at the top of our lungs “POLICY MATTERS!!”

So, here ends the (first) sequel regarding the confusion suffered by experts.  We would be very proud, flattered and humbled if we could say we have prevented even a single person from becoming an “expert.”

We could never adequately express our appreciation of you for talking the time to read our posts.

Thank you.

Every effort is made to ensure accuracy of data transcription but accuracy cannot be guaranteed.  The official release site should be cross referenced.  The analysis represents the opinion of Blue World Asset Managers, Ltd. who does not warrant or guarantee predictions based on its analysis.

©Blue World Asset Managers, LTD Friday, April 27, 2012

Employment Situation Analysis 4-6-2012

Blue World Employment Situation Report Analysis

Release Date:  Usually the first Friday of each month

Release Site: www.bls.gov

Market Sensitivity: VERY HIGH

Management Value: VERY HIGH

Friday, April 06, 2012

Brain surgery is not rocket science to a brain surgeon©

Sometimes it’s no fun to be right.  This is the report we have been dreading…and predicting.  Headlines are headlines and spin is spin, but the details will tell the story more often than not so let’s dig into ’em. 

The rate fell again but even the mainstream analysis we’ve skimmed seems to be acknowledging that it’s not “good” news by virtue of the recent phenomenon of a shrinking labor force in the face of an increased number of employed people.  In case you missed it there is a broader explanation of this in our post at http://owl.li/8kHlp.  This month, however, the news is a little worse.  Not only did the number of jobs created not outpace the reduction in the civilian labor force giving us the lower percentage, but the total number of unemployed people actually rose too.  This illustrates the deficiency in the number of jobs being added not keeping pace even as the labor force shrinks!  Moreover, it is historically unusual to see a drop in the labor force in the spring and summer months.  A more typical pattern is to see the force rise into summer before dropping off as fall approaches.  March 2012 demonstrates a significant deviation from that pattern.

There has been no change in the 25+ with a Bachelor’s degree and higher group.  That continues to be the most ominous sign for us.  Wages grew again, but at a miserably sluggish pace that continues to be materially slower than inflation.  That does not bode well for continued strength in consumer spending.  We fear the recent optimism generated by durable goods and auto sales represents more of a deferred spending blip than a sustainable trend.  The work week actually declined in total hours (-.1) for the first time in a while.  That is an off-the-radar ill-omened sign.  Worse is that while manufacturing added a few jobs, their work week declined by a more alarming .6 hours and overtime remained absolutely flat.  This is more evidence of the difficulty regarding lower productivity and higher unit labor costs.  You can hear a broader explanation of that dynamic at http://owl.li/9zUkI.  It is the audio of Matt’s appearance last month on The Noon Business Hour on CBS radio WBBM AM 780 in Chicago to discuss the jobs report within the context of the economy at large.  Construction continued to shed workers and their weekly compensation actually fell.  This does not corroborate some recent optimism in housing related headlines.  Those unemployed for 27 weeks or more was essentially flat but down a bit, none the less.  The more concerning number is the increase in the number unemployed for less than 5 weeks.  Those are new job losses and another example of why the wild market reactions to the weekly new unemployment benefits applications is unjustified.  That stat is an unreliable predictor of the monthly jobs report.  You can learn more about that in our post “The Confusion Suffered by ‘Experts'” in the blog archives at www.blueworldam.com.

Is the data “good” or “bad?”  We don’t see it as either.  The data is the data.  The impact on the economy is certainly either positive or negative.  In our view “good” and “bad” refer to the quality of the decisions business owners, managers, and investors make based on the data.  Limiting your analysis to reading the headlines will often lead to “bad” decisions.  Following trends within the detail compared with the detail from other reports held up against what we see in real life every day is what constitutes actionable intelligence and enhances the opportunity to make “good” decisions.  This is the area where we hope we help.

Thanks for reading and, please, stay tuned…

Release Site: www.bls.gov
Every effort is made to ensure accuracy of data transcription but accuracy cannot be guaranteed.  The official release site should be cross referenced.  The analysis represents the opinion of Blue World Asset Managers, Ltd. who does not warrant or guarantee predictions based on its analysis.
©Blue World Asset Managers, LTD Friday, April 06, 2012