Tuesday, August 16, 2011
Brain surgery is not rocket science to a brain surgeon.©
The Confusion Suffered by “Experts”
We are being asked a question pretty routinely lately. In our Tweets and our blog posts we always exhibit an enthusiastic irreverence for certain economists, market commentators, media personalities and politicians by identifying them as “experts.” We go on to explain why what they said was silly. We have little use or respect for those whose headlines routinely contain words like “unexpected”, “surprised”, etc. We often review our past posts regarding our opinions on where the economy is headed to make sure we have had a good handle on what is going on or if we need to shift our observational and analytical methodology. Ya see, “experts”, that’s what you do if your analysis, decisions and policy aren’t working. We are pleased yet sad to say if you follow us none of the economic data that “surprises” the “experts” is ever a bombshell for you. This has led many of our readers to ask Why are the “Experts” Always Wrong?
There are several reasons ranging from academically focused and financially motivated to politically goaded. In other words we must always consider the source. The financially and politically motivated crowd is, we believe, reasonably small. Advocates of the party in power will try to up-spin data and market beneficiaries have a vested interest in making any news look as good as possible. That leaves a much larger group that is just plain wrong. Why are these “experts” so easily misguided by the same data we review? We have a theory. The problem is mostly academic. Blue World employs people. Blue World principals and network resources employ lots more people. Blue World clients employ lots, lots more people. Decisions on how many are employed is partially based on a comprehensive review of the economic data released, just like many of our “experts.” The difference is we HAVE EMPLOYED REAL PEOPLE and INVESTED REAL MONEY to make businesses (our own and our client’s) successful in the private sector. We don’t just sit in cubicles and read data. We compare the data to what we see happening around us in the real world. Just driving around town or across the country and taking note of strip mall vacancies can give some great anecdotal corroboration or refutation of the spin in the headlines.
Data is just that. Data. It should be used as a metric against which to measure reality. If we don’t understand how the data is gathered we are likely to make poor decisions based on it AND be at the mercy of those who do know and choose to ‘spin.’ For example, the unemployment rate dropped .1% last month. Good news, right? Not if we know how to read the report. The number of unemployed people actually rose but the sample size changed such that the number of people being counted shifted. This created an artificial improvement the percentage even though reality worsened. This is an observation, not an accusation, but I’m afraid there is a degree of estimating that goes into the BLS Unemployment numbers, and that creates the opportunity to mislead at the headline. That’s why Blue World does the monthly analysis, to remove the spin and provide actionable intelligence to business owners, managers and investors.
Another example: a great deal of predictive emphasis is placed on the ADP job numbers. As the largest payroll processor in the company it is assumed that an increase in processed paychecks equals positive private sector job growth. The problem is that ADP counts all payrolls, not all workers. In other words one worker may be holding down three part-time jobs because he can’t find full time employment. This looks like three new jobs but it is only one person working! This statistic is not accounted for in the ADP report but is in the BLS release. It is called “Employed Persons at Work Part-Time for Economic Reasons.” “For Economic Reasons” means a worker wants full time work but can’t find it. It is found in Table A: Household Data of the monthly BLS report. If we see a rising trend in the ADP report and want to deduce good or bad news from it we must compare that to the trend of part-timers for economic reasons. If that trend is also rising we don’t have a good trend for private sector employment.
We did a blog some time ago that shows how all of the economic reports out there have just one common goal. They all seek to determine what our mood is. That’s really it. The full post is entitled Is There a Meaningful Economic Recovery Going on Out There? and can be found at http://ow.ly/4M2Dn It shows what we predicted for the economy over a year ago. Sometimes it’s no fun to be right. The most relevant passage to this post follows:
Now, there are boatloads of economic releases that come out each week, month, quarter, year. There is GDP, the unemployment report, housing starts, consumer confidence index, new home sales, existing home sales, new housing permits, first-time jobless claims, factory orders, manufacturing index and on and on and on… What I want you to realize is that for all the data gathered, analyzed and reported on they all have just one common objective. It is to see what kind of mood you and I are in as consumers. If we can determine what kind of mood the consumers are in and what their spending patterns are we can predict which way the economy is likely headed. If unemployment is headed down, personal income is increasing and GDP is rising it is a darn good bet that good times are-a-comin’.
Often times spin of the data is used to try to shape our mood rather than identify it. Those who read the detail (or our analysis) are inoculated against such manipulation.
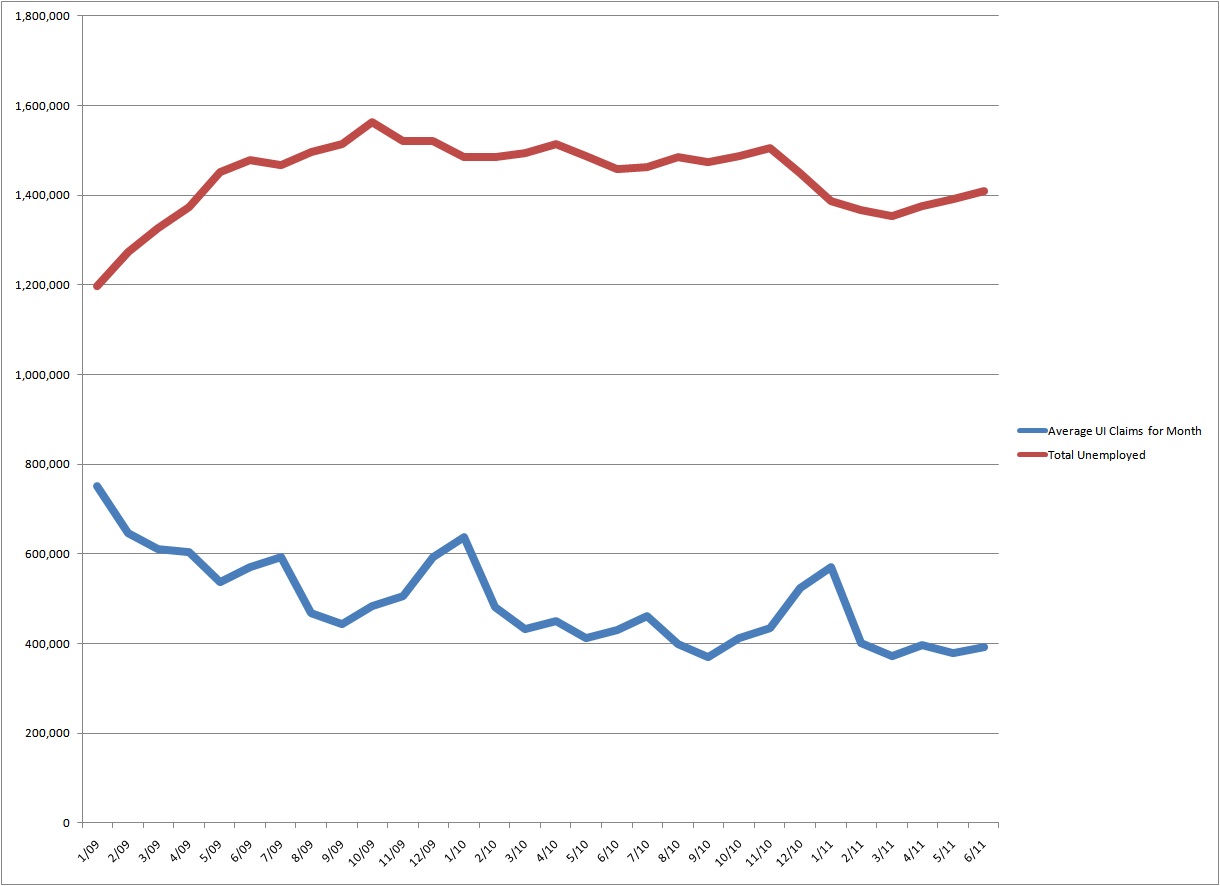
So how are the truly unbiased “experts” fooled? We have data that comes out weekly, like first-time unemployment insurance claims; monthly, like the Bureau of Labor Statistics (BLS) employment report; and quarterly, like the Gross Domestic Product (GDP) report. All too often our “experts” use the weekly type releases as predictors of the longer term data. The correlation during robust recovery and distinctly weakening times can be quite good. At times of bouncing along the bottom or flying at cruising speed, however, the predictive value predictably deteriorates! If all you do is sit in a cubicle and look at data (like our “experts”) you’re just going to be wrong due to the inconsistent and sometimes volatile nature of the more short term data. To illustrate this point the graph below shows the average number of new unemployment insurance claims (weekly) graphed against the actual number of reported unemployed people (monthly) divided by 10 to match the scale.
Source: www.bls.gov & www.dol.gov
As you can see, if you were to use even the weekly average new claims (blue line) to predict the unemployed totals (red line), you would regularly be “surprised.” If you were to look for news, good or bad, in the actual weekly numbers you can appreciate that they are even more volatile and unpredictable than the smoothed-out average represented above. That’s why we roll our eyes and shake our heads when the markets throw a party or a wake every Thursday when the new unemployment insurance claims are announced.
Any one week, month or quarter’s data does not tell us anything in a vacuum. Convincing medium to long-term trends coupled with real-world observations ranging from personal income and internal sales to store front vacancies and the mood of our neighbors are the only way to accurately assess the true health of the overall economy. This type of ongoing observation and analysis of DATA AND THE REAL WORLD is the only way responsible investors, employees, managers and owners (remember that managers and owners are also employees) make decisions about their businesses. We say brain surgery is not rocket science to a brain surgeon. I am certainly neither. But even I can predict 9% unemployment, record foreclosures, rising food and gas prices, historically low interest rates, unfathomable Federal debt, ubiquitous commercial vacancies and an ever-weakening dollar do not add up to a recovering economy! This is why I, and I suspect you, will NEVER be an “expert.”
© Tuesday, August 16, 2011Blue World Asset Managers