Blue World Employment Situation Report Analysis

Release Date: Usually on the first Friday of the month

Release Site: www.bls.gov

Market Impact: Usually Very High

Management Value: Critical

Date Monday, May 08, 2017

 Brain Surgery is not Rocket Science to a Brain Surgeon©


Well, that’s a little better. The details are still weaker than we’d like to see, but last month’s train wreck does look like an outlier. While we thought there may be an upward revision to March, we saw the opposite as it moved from 98k to 79k. The Labor Market Conditions Index, as we expected, did show much stronger than the BLS headlines would have implied. So, what about April?

April looked much better at the top with the 211k. Slightly disappointing, however, is that the private sector remained below 200k at 194k. In spite of that and the mind-numbing March numbers, the Private Sector is already averaging 14k higher per month than 2016.

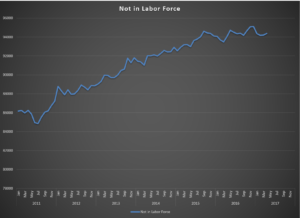
The Participation Rate is sub-63 with a very disappointing 162k returning to the Not in Labor Force group, BUT we may be able to start to hallucinate a flattening of that graph for the first time in many years. That’s the chart this month. Feel free to let us know if you see what we see. Total Employed and Total Unemployed both made solid moves in the right direction while the Total Private and Manufacturing diffusion indexes remain comfortably above 50. That is all wonderful to see.

Wages? Meh. The work week remains range-bound as does overtime in Manufacturing.

The Fed’s Labor Market Conditions Index won’t post until 10:00a Eastern, and we want to get this to press, so we will simply predict an improvement there as well. They do, after all, reject the “expert” analyses and read these things the way Blue World does…

Have a great month and we’ll see you here at the back end with the Blue World Economic Index® summary.

As always, thanks for reading, and please stay tuned…


Release Site: www.bls.gov


Every effort is made to ensure accuracy of data transcription but accuracy cannot be guaranteed.  The official release site should be cross referenced. The analysis represents the opinion of Blue World Asset Managers, LTD. who does not warrant or guarantee predictions based on its analysis.


©Blue World Asset Managers, LTD Sunday, May 07, 2017

Blue World Economic Index® for April 2017


Brief Explanation of the Index


Blue World Economic Index®

Scale: -2 to +2

Release Date:  Usually the Last or First Business Day of Each Month

Release Site: www.blueworldassetmanagers.com

Management Value: Critical

Release Site: www.blueworldassetmanagers.com

Date: Monday May 1, 2017


Brain Surgery is not Rocket Science to a Brain Surgeon©


The gulf between consumer and institutional optimism surveys, and the hard performance data continues to be the story in the Blue World Economic Index®. Consumer mood and anecdotal institutional survey data continue through the roof, although there was some pullback at the institutional level in April. Nevertheless, retail and consumer spending were bordering on abysmal for the month so the aforementioned gulf actually widened when the whole I’m-an-economics-geek world expected it to start showing signs of narrowing!

The composite index was essentially flat coming in at -.12 compared with -.11 in March. That flatness is on the back of a major surge and some trend upgrades very late in the month right up to and including Friday morning. It makes some sense to post the whole Major Category table this month in order to limit what could easily run into three pages of explanation, but we will hit the highlights and lowlights here in the text body. Let’s start with the weak, and work our way better.

Of the eight major categories, the far and away biggest losers were Services and Employment, both posting .17 drops. Yes, we said Employment, regardless of all the nonsense we hear about how great the labor market is. We still have WAY too many people in the Not in Labor Force camp to say employment is strong. Retail took a hit, and that was in large part due to a slowdown in auto sales.

On the upside, Consumer measures are on a rocket ride that just won’t slow down, and that even includes Sentiment which takes party affiliations into account. This is just bizarre when compared to consumer spending, which was the biggest hit to Friday morning’s GDP report.

As you can see above, the Fed subgroups did pull back a bit but are still strongly positive at .3, but the hard data from the non-Fed group breakout are decidedly negative and moving down.

Q2 will be fascinating to watch as this economy struggles to find a direction. In the meantime, look for the Blue World Jobs Report Analysis next Friday or Monday.

Have a great May and a happy spring!


Every effort is made to ensure accuracy of data transcription but accuracy cannot be guaranteed.  The official release sites should be cross referenced.  The index assignments represent the opinion of Blue World Asset Managers, Ltd. who does not warrant or guarantee predictions based on the index.
©Blue World Asset Managers, LTD Monday, May 1, 2017

Blue World Employment Situation Report Analysis 04-07-2017

Blue World Employment Situation Report Analysis

Release Date: Usually on the first Friday of the month

Release Site: www.bls.gov

Market Impact: Usually Very High

Management Value: Critical

Friday, April 07, 2017

Brain Surgery is not Rocket Science to a Brain Surgeon©

BLS

Bad at the headline and worse for the Private Sector, but usually when this happens we talk about the really bad stuff hiding deep in the weeds. For as much as we say the devil is in the details, sometimes we find an angel or two. That’s the case today and a very welcome surprise considering the train wreck of a headline we woke up to.

The published number is 98k, and that’s bad enough, but the private sector came in 9k below that at just 89k. One of the most striking things about that number is how far it deviates from the ADP report from Wednesday. We never consider ADP to be a good predictor, but it is rarely that far afield, and the Participation Rate is still at only 63%.

After that the skies start to brighten slightly. The Civilian Labor Force grew by 145k, and the Not in Labor Force number remained essentially flat. Construction and Manufacturing, while off their torrid paces of the last couple of months, remained comfortably in the plus column, and the Diffusion Indexes for total private industry and manufacturing remained above 50, indicating growth.

The real eye-popping stats, however, were the Total Employed and Total Unemployed entries, with the former checking in at +472k, and the latter falling by 326k. Those are some very pretty stats and all the more surprising and welcome in the face of the net new hire numbers. We don’t need to talk about the uselessness of the Unemployment Rate, right?

What does it all mean? Good question. Based on what we see in the deep end of the data pool, we will be curious about a revision next month, because some of these numbers just don’t line up. We also think that the Labor Market Conditions Index will show some strength on Monday. The earliest data post healthcare fail shows the consumer continues undaunted, but translation to hard spending data has not materialized yet. You can see more about that in the Blue World Economic Index® report published last week.

This will be an interesting month. Trucks are running people over everywhere, Syria is gassing its people, we gave Assad a missile shower, and a Russian war ship has set course to intercept the U.S. destroyers that provided the spray! The Senate was forced into the nuclear option, healthcare reform failed, tax reform is in question, and we effectively have three parties occupying the Congress. Of course there’s more, but that’s enough to get us started!

See you at the back end of April for the next Blue World Economic Index® report. In the meantime, may you manage your business well!!


Thanks for reading, and please stay tuned…


Release Site: www.bls.gov


Every effort is made to ensure accuracy of data transcription but accuracy cannot be guaranteed.  The official release site should be cross referenced. The analysis represents the opinion of Blue World Asset Managers, LTD. who does not warrant or guarantee predictions based on its analysis.


©Blue World Asset Managers, LTD Friday, April 07, 2017

Blue World Economic Index® for March 2017

Brief Explanation 

Blue World Economic Index®

Scale: -2 to +2

Release Date:  Usually the Last or First Business Day of Each Month

Release Site: www.blueworldassetmanagers.com

Management Value: Critical

Friday, March 31, 2017


Mar 17 Graph


The economy continues its slow ascent toward the surface as there was material improvement for March 2017, although we are still under water according to the latest reading of the Blue World Economic Index®.

The overall composite moved North by .05 taking us from -.16 to -.11.  Of the eight major categories, advancers included General Measures, Consumer, Employment, Manufacturing and Real Estate, with Employment leading the way. Inflation readings remained flat while Retail and Services slipped. This is in line with the GDP, and Personal Income and Outlays reports which came in over the last two days. Consumer Measures and Real Estate remain the only two in positive territory, and quite comfortably at that, logging .22 and .23, respectively.

Consumer Measures and Manufacturing, most notably the Fed Sub-Groups, continue to be the most fascinating as they are largely anecdotal and survey-driven data sets. Optimism is through the roof for firms and consumers, but it still has not carried over to the hard data. For example, Consumer mood measures, which are looked to as a predictor of retail spending, improved by another .03 and have been rising uninterruptedly since election day, but the Retail composite gave back .03, largely on a drop in autos, as inventories build at the retail and wholesale levels. The Manufacturing composite improved by .03, but that was on the strength of the Fed Sub-Groups (+.22) versus the hard data, non-fed reports which remained flat at -.18.

What’s the wild card in all this? For all the optimism leading the way, most of the data was collected before the legislative healthcare fail. That hiccup, plus the continued questions about Russia and the recent announcement by Mike Flynn that he seeks immunity for testimony can’t help but throw some cold water on the institutional and consumer mood in April.

We’ll keep an eye on all of it and report back here next month. The Blue World Jobs Report Analysis for March will be out next Friday the 7th. See you then.

As always, thanks for reading.


Every effort is made to ensure accuracy of data transcription but accuracy cannot be guaranteed.  The official release sites should be cross referenced.  The index assignments represent the opinion of Blue World Asset Managers, Ltd. who does not warrant or guarantee predictions based on the index.
©Blue World Asset Managers, LTD Friday, March 31, 2017

Blue World Economic Index® for February 2017

Brief Explanation


Blue World Economic Index®

Scale: -2 to +2

Release Date:  Usually the Last or First Business Day of Each Month

Release Site: www.blueworldassetmanagers.com

Management Value: Critical


Tuesday, February 28, 2017


Feb 17 Graph


The index is on the move…but still betting on the come! Overall, the composite improved by .08, moving from -.25 to -.16, a healthy jump. Six of the eight major categories are still running in the negative, but six of the eight also improved in February.

From a hundred thousand feet conditions appear to be improving, but the charge is clearly being led by the surveys of anticipation as opposed to the hard data. Is that ok? Of course! As we’ve said, no optimism, no recovery. But the delta is rather striking and nowhere more than in Manufacturing. That category follows twelve reports each month. Six of them make up the Regional Fed Manufacturing Districts sub-group survey reports. The hard manufacturing data actually slipped in February, but the Fed sub-group jumped by .17 to post a +.2! That says managers are optimistic that things are going to pick up rather quickly. Let’s hope it develops that way.

Policy matters, and in fact, anticipation of policy matters. The prospective changes that are being advertised have the general business community and the consumer in a very giddy mood, but we caution it is still just a good mood driven by optimism, so be excited, but don’t bet the farm until the hard data establishes a verifiable trend. The way it’s looking, we still believe that could show early signs before year end.

The Employment Situation Report is scheduled for release on Friday, March 10.  That may delay The Blue World Jobs Report Analysis until Monday the 13th, but if that’s the case it will incorporate the Labor Market Conditions Index analysis so there will be a little more meat on the bone.


Have a great month!


Every effort is made to ensure accuracy of data transcription but accuracy cannot be guaranteed.  The official release sites should be cross referenced.  The index assignments represent the opinion of Blue World Asset Managers, Ltd. who does not warrant or guarantee predictions based on the index.

©Blue World Asset Managers, LTD Tuesday, February 28, 2017