Blue World Employment Situation Report Analysis 06/05/2015

Blue World Employment Situation Report Analysis

Release Date:  Usually the first Friday of each month

Release Site: www.bls.gov

Market Impact: VERY HIGH

Management Value: Critical

Friday, June 05, 2015


Brain surgery is not rocket science to a brain surgeon©


Cheers


MIXED!!

Ok, perhaps a bit pathetic to express such exuberance over “mixed” but we have to give credit where it’s due.  All the focus will be on the 280k jobs which is a solid post.  The problems usually show up below the headlines, and this month is no exception, BUT some of the underlying data support the headline.  We haven’t seen that in, well, years!  So let’s have a look.

On the plus side…

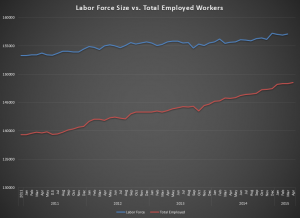
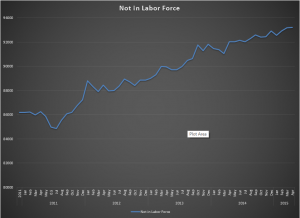
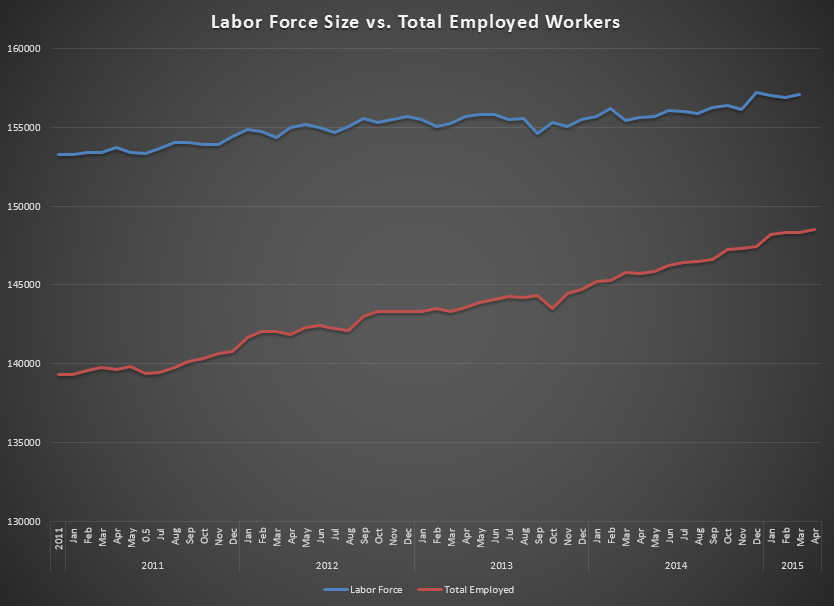
The headliner is 280k, but the important metric is the private sector tally which stands at 262k, 13k above the twelve month average.  The civilian labor force grew, the total employed count rose, the number of those not in the labor force fell slightly below 93M, and private sector payrolls logged a solid gain.  Folks, that’s a positive on four out of the first six metrics we use to analyze the report.  That is a record for recent times.

Some negatives?  Yes. The fact that we got so many jobs with a corresponding increase to the unemployment rate is always a clue that something is amiss.  The participation rate ticked up to 62.9, but so what?  That is still hovering near “recovery” lows.  The total number of those reporting they are unemployed grew, the work week remains tightly range-bound, and wages continue to be uninspiring especially in the face of the exceptionally weak Productivity and Costs report from earlier this week.  Of significant note is that the diffusion index in manufacturing has been struggling to stay at 50 and fell below again in May.  That tells us the manufacturing sector is in contraction.

The Blue World Economic Index is still slightly negative, with 4 out of 8 segments sporting negative composites so if you employ real people, run a real business, and invest real money we recommend continued caution.

More positives than usual for May of 2015 might be a good start but as we know, it’s not the report that matters.  It’s the trend.

So…here’s to hoping for a positive new trend!

Thanks for reading and, please, stay tuned…


Release Site: www.bls.gov

Every effort is made to ensure accuracy of data transcription but accuracy cannot be guaranteed.  The official release site should be cross referenced.  The analysis represents the opinion of Blue World Asset Managers, Ltd. who does not warrant or guarantee predictions based on its analysis.

©Blue World Asset Managers, LTD Friday, June 05, 2015


Blue World Employment Situation Report Analysis 05/08/2015

Blue World Employment Situation Report Analysis

Release Date:  Usually the first Friday of each month

Release Site: www.bls.gov

Market Impact: VERY HIGH

Management Value: CRITICAL

Friday, May 08, 2015

Brain surgery is not rocket science to a brain surgeon©

Don’t the markets just kill ya?  The report is weak, BUT the market is flying because…revisions downward last month make the current as-expected numbers look like the economy is improving, but not improving well enough to cause fear of a rate hike by the Fed!  WOW! “EXPERTS!”   We still remember when economic fundamentals were more important to the markets than government activity speculation!

Yes, revisions are back in the news this month.  Over the past three months the net jobs added was reduced by 39,000, giving us a three month average 191k net jobs per month.  That includes reducing an already dismal 126k estimate from March down to 85k.  When we look at just the private sector, which is what we care about, that drops to 189k per month.  That won’t cut it.  But, as we know, the unemployment rate and the net number of jobs no longer tells us anything about the health of the labor market because the labor force is growing far more slowly than jobs, giving us that artificially low unemployment rate.  That trend continues uninterrupted.

The number of those Not in the Labor Force grew, again, and now stands over 93M, a mark we broke in March.  Remember, they are not counted as “unemployed” for the rate calculation because they haven’t looked for work recently.  Factor them in, and the true unemployment rate is in the 11% neighborhood while the participation rate is still wallowing around “recovery” lows.

The work week for the private sector is still flat, but some data in the deep end of the pool is more revealing and consistent with other reports from the past months.  Manufacturing weekly hours fell to 40.8, a number not seen since April of 2014, but Overtime Hours in Manufacturing is on a four month slide now down to just 3.2 hours per week.  We had to go all the way back to July of 2013 to see a number that weak.  Hourly earnings are still uninspiring at 2.3% for the full private sector.  Construction is the better at 2.6% for 12 months, and manufacturing lags at 1.7%.

The first graph shows the growth of the labor force relative to jobs growth, and the other shows the growth of those Not in the Labor Force. We could have added the Participation Rate graph, but why pile on?

Size 5-15

Not In 5-15

If you’re an “expert” it’s ok to view the report through the prism of paragraph 1.  If you invest real money in real business and employ real people, we have no choice but to recommend continued caution, not just due to this report but because of the 40+ reports followed every month by the Blue World Economic Index which remains in negative territory.

Thanks for reading and, please, stay tuned…

Release Site: www.bls.gov

Every effort is made to ensure accuracy of data transcription but accuracy cannot be guaranteed.  The official release site should be cross referenced.  The analysis represents the opinion of Blue World Asset Managers, Ltd. who does not warrant or guarantee predictions based on its analysis.

©Blue World Asset Managers, LTD Friday, May 08, 2015

Blue World Jobs Report Analysis 2-6-2015

Blue World Employment Situation Report Analysis

Release Date:  Usually the first Friday of each month

Release Site: www.bls.gov

Market Sensitivity: VERY HIGH

Management Value: VERY HIGH

Friday, February 06, 2015

Brain surgery is not rocket science to a brain surgeon©

Capitol - 1


Hey fellas, Pay Attention!!

It just keeps getting weirder…

There were huge revisions to the upside for December and November 2014, yet the number of those unemployed for less than five to more than 27 weeks jumped.  The unemployment rate went up.  The participation rate remains below 63%, and the number of those unemployed rose…again.  Fuzzy math indeed.

That sums up a lot of the relevant numbers for January 2015, but also of note is that the headline number for this month was 257k new jobs.  In a reversal from the norm, the private sector number was better than that (267k) because government reports shedding 10k jobs for the month.  Hours and wages for the total private sector, construction and manufacturing remain uninspiring and that is consistent with data from all the other economic releases over the past month.  Of particular note are the Factory Orders and Productivity and Costs reports.  The number of those at work part-time for economic reasons is up, and sadly, there are 1.1M more citizens Not in the Labor Force than there were in January of 2014.

We follow over forty reports per month, note the data points as they’re published and follow the short and long term trends.  We put it all together for an overall profile of our economy and the profile is flat. How many times can we say it? (Rhetorical)  Policy matters and these don’t work.

Thanks for reading and, please, stay tuned…

Release Site: www.bls.gov


Every effort is made to ensure accuracy of data transcription but accuracy cannot be guaranteed.  The official release site should be cross referenced.  The analysis represents the opinion of Blue World Asset Managers, Ltd. who does not warrant or guarantee predictions based on its analysis.

©Blue World Asset Managers, LTD Friday, February 06, 2015

Key Labor Market Metrics 2011 – 2014

Here are the key metric graphs reflecting the annual data with revisions and including the full years of 2011 – 2014.  Revisions were minor and did not alter any of the poor short or long term trends reflected.

Starting at top, left we have the size of the labor charted against the total number of those employed.  We can see as the lines converge the unemployment rate calculation will become smaller even though there is no improvement in the labor force.  This point is validated moving to the right and then below, left showing the participation rate and the number of those no longer in the labor force.  The fact that the graph showing those no longer in the force is rising faster than the total employed line is very unsettling and not recovery-esque. Finally at below, right we see the length of the work week showing a very narrow average over the period.


Graphs - 2011-2015


Blue World Jobs Report Analysis 12-05-2014

Blue World Employment Situation Report Analysis

Release Date:  Usually the first Friday of each month

Release Site: www.bls.gov

Market Sensitivity: VERY HIGH

Management Value: VERY HIGH

Friday, December 05, 2014

Brain surgery is not rocket science to a brain surgeon©

Whoa!  321k!!  Folks, that number by any standard is a solid number.  The total we care about is the private sector tally, and even that is a very respectable 314k, net of the 7k new government jobs.  Is there still some hair on the good news?  Yes, but let’s take a rare moment in recent jobs report history and say November 2014 was a good month for net new job growth.  I wish we could end it there, but we are obligated to share the caveats and cautions, so here we go…

The fuzzy math continues to play havoc with the unemployment rate, which didn’t move in spite of the best job growth in a long time.  That phenomenon is validated by an unchanged participation rate still languishing in record low territory at 62.8%.  Why?  Because even though we had 300k+ new jobs, we also grew the unemployed number by 115k and added 69k to the line item total for “Not in the Labor Force.” In fact, the total of those reporting themselves as “Employed” only grew by 4K.  Those unemployed between 1 and 26 weeks grew by a worrisome 148k, and the diffusion index in manufacturing, while still well above 50, fell by 1.2%.  Wages continue just barely pacing inflation having grown just 2% since November 2013.

25 College History 12-14

As our regular readers know, one of our “go to” metrics when assessing the true health of the labor market is the unemployment rate among those who are at least 25 years old and have a minimum of a four year college degree.  Due to their educational attainment bolstered by real world experience, this group has historically been the most bulletproof when it comes to weaker economies and unemployment.  That has, unfortunately, not been the case of late so we wanted to share some perspective on how this reflects the poor economy.  As of November 2014 the average unemployment rate for this group is 2.8% since the statistic has been recorded.  Prior to 2008 the average unemployment rate for this group was only 2.4%.  Since January of 2008 the average is 3.9%.  Furthermore, this group had never gone more than 13 consecutive months unemployed at a rate of 3% or more, with a record high of 3.4%.  They have now spent six consecutive years unemployed over 3% with a record high above 5%.

Coincidence?  We think not.  Policy matters.

321k is exciting…as long as it becomes the first step in a series of improvements and not just a blip.  Let’s hope some meaningful policy course changes are in the works that can render this the first step in establishing a true and sustainable recovery.

Thanks for reading and, please, stay tuned…

Release Site: www.bls.gov 

Every effort is made to ensure accuracy of data transcription but accuracy cannot be guaranteed.  The official release site should be cross referenced.  The analysis represents the opinion of Blue World Asset Managers, Ltd. who does not warrant or guarantee predictions based on its analysis.

©Blue World Asset Managers, LTD Friday, December 05, 2014