Blue World Jobs Report Analysis 01-09-2015

Blue World Employment Situation Report Analysis

Release Date:  Usually the first Friday of each month

Release Site: www.bls.gov

Market Sensitivity: VERY HIGH

Management Value: VERY HIGH

Friday, January 09, 2015

Brain surgery is not rocket science to a brain surgeon©

Image: John Boehner


Do you hear us, AND ARE YOU LISTENING?!? 

Happy New Year everyone!  We hope the Christmas season was safe and joyous.  Now, back to business.  The jobs report is out and we’ll comment on it as usual but we will also offer a bit broader overview of how the economy fared in general for the period of 2011 – 2014.  We think you’ll find it rather sobering as we did.

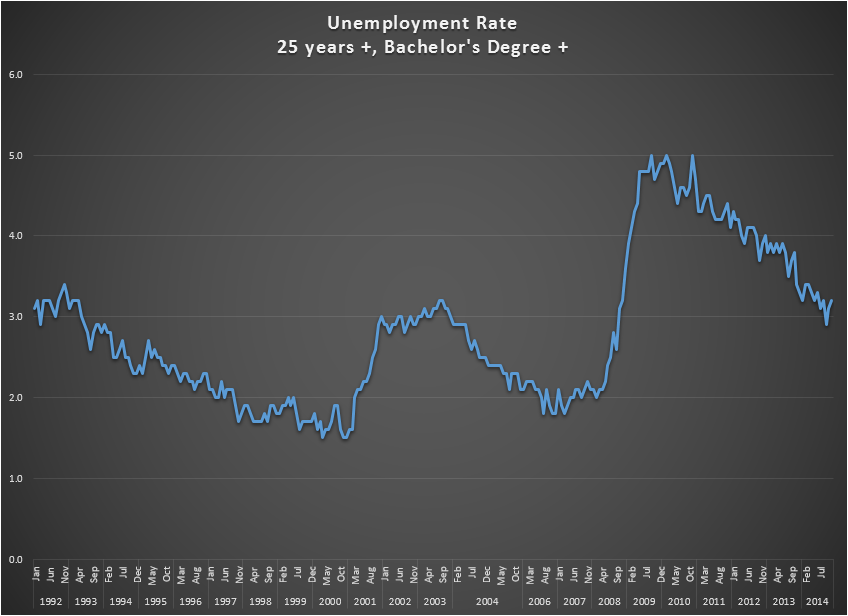
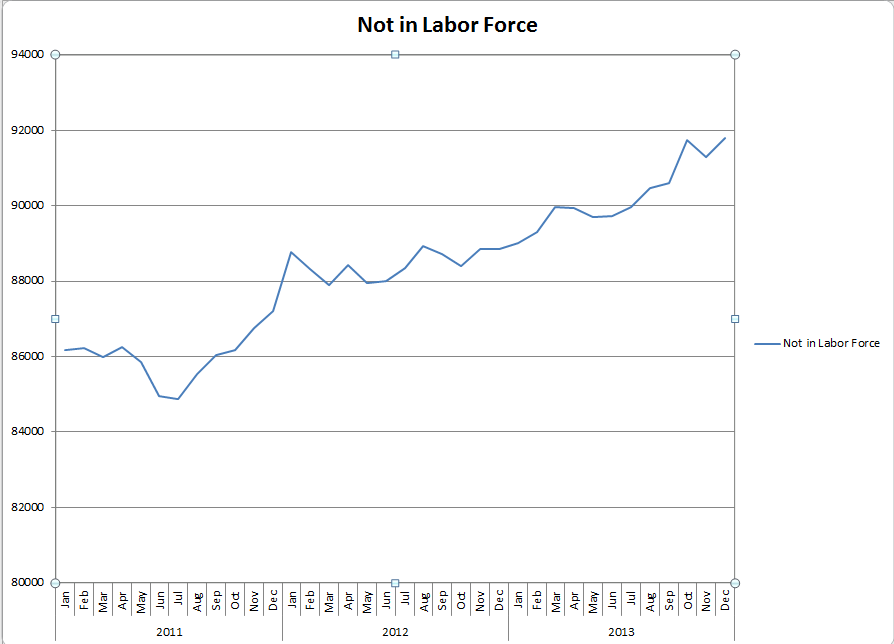
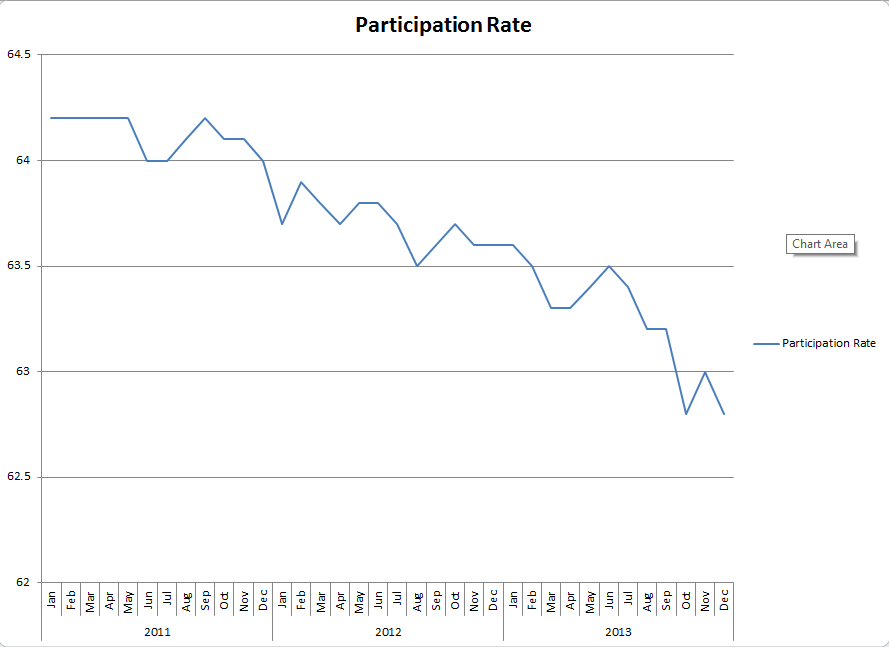
First, the jobs report.  Same ‘ole theme of a decent number of new jobs with the private sector breakout sporting a little less luster than the headline number, which came in at 252k, 12k more than the private sector total.  The labor force shrank by another quarter million plus so, as has been the pattern, the number of those employed grew at a faster rate, further enhancing the irrelevance of the unemployment rate calculation.  The “Not in Labor Force” tally swelled by another half million driving the Participation Rate to equal its “recovery” record low.  There were corresponding spikes in the “Marginally Attached” and “Discouraged Workers” yielding a true unemployment rate just north of 11% which is, of course, also optimistic for the same reasons as the headline number.  Wages across the board, and notably in construction and manufacturing, took a noticeable hit with some downward revisions to previous periods.  The work-week length remained stagnant, BUT there may be a brightening spot.  The overtime hours in manufacturing has demonstrated small but nevertheless consistent increases for the 4th quarter.  Let’s hope that holds.

Annual revisions to the prior data will be showing up beginning next month so graphs may look a little hinky as they can at each New Year, but the patterns will be valid.  Here are some sobering statistics.

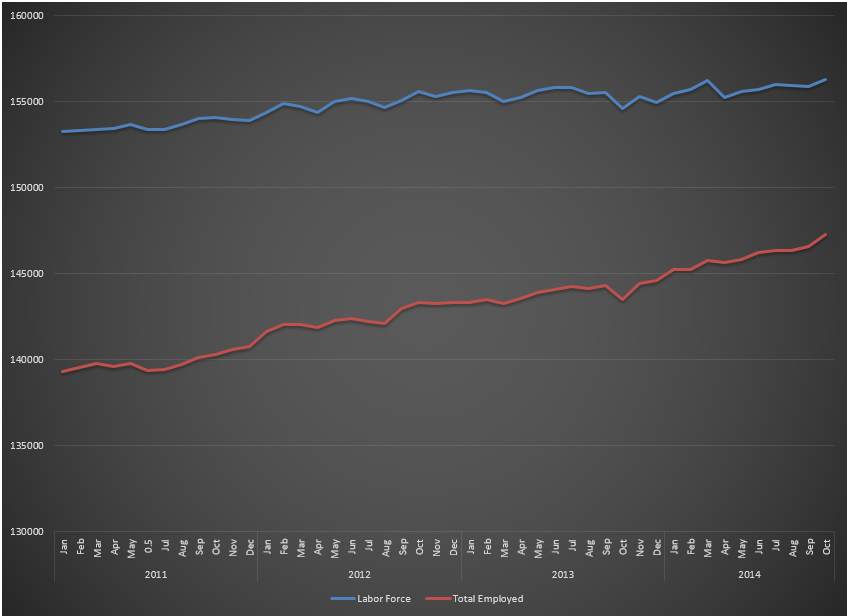
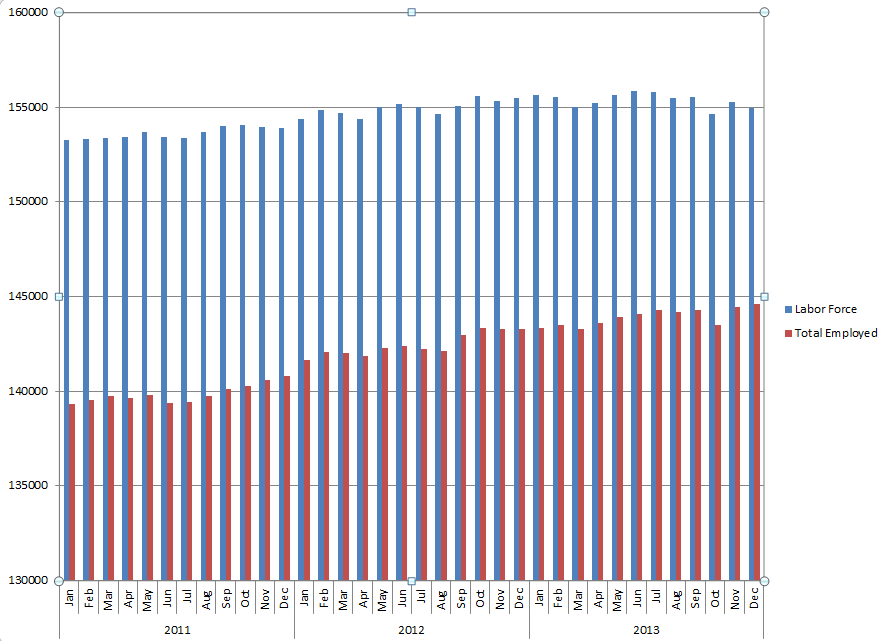
Percent Change for the period:

2013-2014 2011-2014
Labor Force 0.32% 1.45%
Total Employed 1.64% 4.38%
Participation Rate -0.61% -2.00%

This shows quite clearly why we say the unemployment rate as published has lost all credibility and value as a proxy for the health of the labor market and economy at large.

Speaking of the economy at large, well, it’s not declining, but it’s not advancing either.  Blue World tracks over 40 reports per month from both private and public sources in the following 8 categories:

General measures (i.e. GDP)

Consumer mood and activity

Employment

Inflation

Manufacturing

Residential Reals Estate

Retail Performance

Services Sector

Of those, in 2014 five categories were in mild positive territory as analyzed internally at Blue World, and three were slightly negative.  All told, this is still an economy waiting for a direction.  We have repeated the sentiment that policy matters, and it is no secret that we have been very critical of the ones in place.  We don’t care what works, just that it works…and these don’t.  We voters expressed a desire for policy change, and our new hires will take office this month.  Let’s pray they’re listening.

Thanks for reading and, please, stay tuned…

Release Site: www.bls.gov

Every effort is made to ensure accuracy of data transcription but accuracy cannot be guaranteed.  The official release site should be cross referenced.  The analysis represents the opinion of Blue World Asset Managers, Ltd. who does not warrant or guarantee predictions based on its analysis.

©Blue World Asset Managers, LTD Friday, January 09, 2015


Blue World Jobs Report Analysis 12-05-2014

Blue World Employment Situation Report Analysis

Release Date:  Usually the first Friday of each month

Release Site: www.bls.gov

Market Sensitivity: VERY HIGH

Management Value: VERY HIGH

Friday, December 05, 2014

Brain surgery is not rocket science to a brain surgeon©

Whoa!  321k!!  Folks, that number by any standard is a solid number.  The total we care about is the private sector tally, and even that is a very respectable 314k, net of the 7k new government jobs.  Is there still some hair on the good news?  Yes, but let’s take a rare moment in recent jobs report history and say November 2014 was a good month for net new job growth.  I wish we could end it there, but we are obligated to share the caveats and cautions, so here we go…

The fuzzy math continues to play havoc with the unemployment rate, which didn’t move in spite of the best job growth in a long time.  That phenomenon is validated by an unchanged participation rate still languishing in record low territory at 62.8%.  Why?  Because even though we had 300k+ new jobs, we also grew the unemployed number by 115k and added 69k to the line item total for “Not in the Labor Force.” In fact, the total of those reporting themselves as “Employed” only grew by 4K.  Those unemployed between 1 and 26 weeks grew by a worrisome 148k, and the diffusion index in manufacturing, while still well above 50, fell by 1.2%.  Wages continue just barely pacing inflation having grown just 2% since November 2013.

25 College History 12-14

As our regular readers know, one of our “go to” metrics when assessing the true health of the labor market is the unemployment rate among those who are at least 25 years old and have a minimum of a four year college degree.  Due to their educational attainment bolstered by real world experience, this group has historically been the most bulletproof when it comes to weaker economies and unemployment.  That has, unfortunately, not been the case of late so we wanted to share some perspective on how this reflects the poor economy.  As of November 2014 the average unemployment rate for this group is 2.8% since the statistic has been recorded.  Prior to 2008 the average unemployment rate for this group was only 2.4%.  Since January of 2008 the average is 3.9%.  Furthermore, this group had never gone more than 13 consecutive months unemployed at a rate of 3% or more, with a record high of 3.4%.  They have now spent six consecutive years unemployed over 3% with a record high above 5%.

Coincidence?  We think not.  Policy matters.

321k is exciting…as long as it becomes the first step in a series of improvements and not just a blip.  Let’s hope some meaningful policy course changes are in the works that can render this the first step in establishing a true and sustainable recovery.

Thanks for reading and, please, stay tuned…

Release Site: www.bls.gov 

Every effort is made to ensure accuracy of data transcription but accuracy cannot be guaranteed.  The official release site should be cross referenced.  The analysis represents the opinion of Blue World Asset Managers, Ltd. who does not warrant or guarantee predictions based on its analysis.

©Blue World Asset Managers, LTD Friday, December 05, 2014

Blue World Jobs Report Analysis 11-07-2014

Blue World Employment Situation Report Analysis

Release Date:  Usually the first Friday of each month

Release Site: www.bls.gov

Market Sensitivity: VERY HIGH

Management Value: EVEN HIGHER

Friday, November 07, 2014

Brain surgery is not rocket science to a brain surgeon©

What can we tell you?  Same ole’, same ‘ole…but we are not blind to the fact that that, in and of itself, it is a slight improvement even if for just one month.  We have had many reports over the last several years that were of the copy-and-paste sort, and then we’ve had those that fell well short of copy-and-paste by virtue of the detail exposing the truth about how bad it was in spite of the headline numbers.  That might cause copy-and-paste to become a bit of a relief.  But let’s be honest, this is not a “good” report, the labor market is not improving, and this is not a “recovery.”

The headline says 214k new hires, but the number we care about, the private sector, only added 206k.  Last month we pointed out the Not in Labor Force number was growing faster than the number of new jobs created each month.  Some of our “expert” critics are already elbowing us (electronically) this morning about the 206k drop in that stat.  Ya know how we keep sayin’ trends and comparisons matter a lot more than data points?  Maybe we can teach those “experts” something here.  True, the number did drop by 206k, but in spite of that there are still 622k more than there were in October of 2013!!  We know our readers get it, but the experts need pictures so we’ll put in the graph later.  For now, here is some perspective.

  • The number of Employed Persons is 147,283M
  • The number of persons Not in the Labor Force is 92,378M
  • Since January of 2011 the Labor Force has grown by 2%
  • Since January of 2011 the number of Employed has grown by 6%
  • Since January of 2011 the number of persons Not in the Labor Force has grown by 7%

The 2% growth in the labor force vs. the 6% growth in employed people further illustrates why the unemployment rate, as published, is invalid as an economic metric, as well as both being pathetic for a three year period in the United States of America economy!.  The work week and manufacturing overtime remain flat, the participation rate is still languishing in record low territory, those unemployed with a Bachelor’s degree or higher ticked up, and meaningful wage growth remains absent.  Here’s that Not in the Labor Force graph with the labor force vs employed thrown in for good measure.

NILF for 11-7-14 PostFvE for 11-7-14

Maybe a cubicle-based “expert” can look at 92 million Americans (or whatever) out of work and see a “recovery,” but for those of us insophisticates who just own or manage businesses, invest real money, employ real people and make decisions that actually affect the economy, well, let’s just say “we don’t see a recovery.”

How many times can we say it; policy matters and these aren’t working.  Do we have some optimism that the election results from 11/04/2014 can lead to some more effective policies?  Yes, but remember, Washington is full of “EXPERTS!”


Thanks for reading and, please, stay tuned…

Release Site: www.bls.gov

Every effort is made to ensure accuracy of data transcription but accuracy cannot be guaranteed.  The official release site should be cross referenced.  The analysis represents the opinion of Blue World Asset Managers, Ltd. who does not warrant or guarantee predictions based on its analysis.

©Blue World Asset Managers, LTD Friday, November 07, 2014

Blue World Jobs Report Analysis 4-4-2014

Blue World Employment Situation Report Analysis

Release Date:  Usually the first Friday of each month

Release Site: www.bls.gov

Market Sensitivity: VERY HIGH

Management Value: VERY HIGH

Friday, April 04, 2014

Brain surgery is not rocket science to a brain surgeon©

How often did you find yourself in math class laughing out loud because arithmetic was so funny?  It is so rare for remedial math to be entertaining that we feel obligated to revisit the who’s-on-first dynamic of the employment numbers relative to the unemployment rate.  In January we added 145k, and the unemployment rate got better.  In February we got 162k, and the rate got worse.  Now we get 192k and rate is – wait for it – UNCHANGED!

By now most of us have heard the 192k with an unchanged rate of 6.7% headlines, so let’s do what we do and take a look at what it really means.

As usual, there were no seismic changes during March 2014, so we would expect that things are about the same, and they are…with a couple of insidious trends emerging that are way off the radar of the media folk  and “experts.”  We’ll get to those in a bit.

The “expert” consensus called for about 206k new hires with estimates covering a wide range from 175k on the low side to 275k on the high end.  Emphasis on the last in recognition of the likelihood that particular “expert” is from Colorado, voted in favor of the referendum to legalize pot and was partaking when rendering his estimate!  The 192k number is the net for total private hires as government neither added nor lost jobs for the month.  There was a significant upward revision to the February number from 175k to 197k, but that is still way short of what we’d consider acceptable in “normal” times much less 5 years into a “recovery.” (BTW, even with that revision the rate is ‘unchanged’)

The participation rate remains in record low territory, and in spite of an increase of .2 to 63.2, it languishes below the level of a year ago.  This is, of course, continued evidence of the bleeding of available work force.  Those workers 25 years and older with a Bachelor’s degree or better remain frustratingly unemployed at historically high rates.

The work week ticked up a bit but remains range bound and is no better than it was in March of 2013.  Average hourly wages moved backwards while weekly earners fared a little better, and overtime hours in manufacturing remains tightly range bound.

Now for the more insidious stuff…

Those employed part-time for economic reasons appear to be stair-stepping upward.  There were notable increases in the number of those unemployed between zero and 26 weeks, and the number of unemployed people rose in spite of the jobs total, participation rate and marginally attached number.  However, the big one comes from the oft-overlooked diffusion index in manufacturing.  To review, the diffusion index looks at the manufacturing sector as a whole, which is composed of 81 industries.  A diffusion index of 50 indicates as many industries added or remained neutral in terms of new hires as shed jobs.  For the first quarter of 2014 the index has declined January to March at the attention getting rate of 55.6, 51.9, 50.0.  Those numbers are rather startling but it gets worse when we look back and see that in March of 2013 the rate was 52.5.

If you run a business, manage people, invest real money or seek to make a meaningful contribution to the economy the posture must remain defensive because in spite of the irrational public markets behavior, false or foolish optimism, headlines and spin, we have no choice but to conclude that the “recovery”…well…isn’t.

Thanks for reading and, please, stay tuned…

Release Site: www.bls.gov

Every effort is made to ensure accuracy of data transcription but accuracy cannot be guaranteed.  The official release site should be cross referenced.  The analysis represents the opinion of Blue World Asset Managers, Ltd. who does not warrant or guarantee predictions based on its analysis.

©Blue World Asset Managers, LTD Friday, April 04, 2014

Blue World Jobs Report Analysis 01-10-2014

Blue World Employment Situation Report Analysis

Release Date:  Usually the first Friday of each month

Release Site: www.bls.gov

Market Sensitivity: VERY HIGH

Management Value: VERY HIGH

Friday, January 10, 2014

Brain surgery is not rocket science to a brain surgeon©

Happy New Year, everyone.

Capture

Hey, can you smell that?  The jobs numbers are out.  Not only do they stink, the headline stinks even worse!  We would be remiss if we didn’t mention the claims made by our esteemed leaders that unemployment benefits create jobs.  Yes, Pelosi, Obama and Durbin have all said it repeatedly.  Based on the record number of those receiving jobless benefits there should be more jobs than available workers to fill them with an unemployment rate less than zero!  Sadly, neither is true because…wait for it…unemployment benefits DO NOT create jobs.

The unemployment rate fell .3% to 6.7%!  That’s good, right?  SORRY.  Ask yourself, does it make sense that 74,000 jobs could move the needle .3% when 203K the month before (now revised to 241k) could only move it .2%?  We witnessed another huge exodus from the labor force in December, so we continue to see our painfully long trend of more people leaving the labor force than getting jobs. That gives us an increasingly artificial, distorted, misleading and frankly invalid unemployment rate.

There was a decrease of 490K unemployed people, but that isn’t because they got jobs.  It’s because they left the labor force as demonstrated by the half-a-million increase in the number of those not in the labor force and a participation rate that matched its HISTORICAL ALL TIME LOW of 62.8%.  The number of those at work part-time due to slack work or couldn’t find full-time jobs, marginally attached workers and discouraged workers are all up by dishearteningly large numbers, leaving the more accurate unemployment rate just over 13%.  The work week remains range bound and wages grew by a paltry 1.8% year-over-year.  That is of concern when considering the Fed’s recent statements regarding anxiety over inflation.

Below are a few striking graphs.  The first graph gives us the complete picture of those employed relative to the total available work force for three complete years, 2011, ’12, and ’13.  The second demonstrates the hemorrhagic state of the labor force showing the number of those who have left the labor force since 2011.  Remember, since they have “left” the labor force, i.e. have not looked for a job in the past four weeks they ARE NOT counted as unemployed.  The last one shows the participation rate trend for the same time period.  These are so ugly if they were art only a grant from the National Endowment for the Arts would commission them!

Bar - Force vs. Employed

Not in Labor Force 1-14

Participation Rate 1-14

We can’t say it enough, policy matters…and these are not working to the benefit of the American worker, investor, employer and, consequently, family.  We remain cautious regarding investments, expansion and hiring.

Thanks for reading and, please, stay tuned…

Release Site: www.bls.gov

Every effort is made to ensure accuracy of data transcription but accuracy cannot be guaranteed.  The official release site should be cross referenced.  The analysis represents the opinion of Blue World Asset Managers, Ltd. who does not warrant or guarantee predictions based on its analysis.

©Blue World Asset Managers, LTD Friday, January 10, 2014