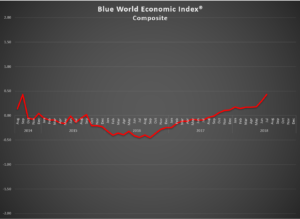
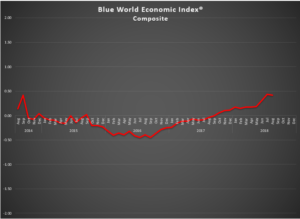
Blue World Economic Index®
Scale: -2 to +2
Release Date: Usually the Last or First Business Day of Each Month
Release Site: www.blueworldassetmanagers.com
Management Value: Critical
Date: September 4, 2018
Analysis
While the Blue World Economic Index® held its ground in August of 2018, there are some indications of turbulence in Real Estate. On the heels of some quarterly trend upgrades last month, this Major Category showed no change for August. That is a bit deceptive, and without some major positive moves in September, simply won’t hold up. This morning’s Construction Spending report does not offer much optimism.
Outside of that the economy remains solid and cautious as things like tariffs, trade deals, mid-term elections, investigations, SCOTUS hearings, and porn star pay-offs exert their material impacts.
The Numbers
The index held essentially steady at .42, which, while a tick below July, represents a decimal rounding.
Seven out of eight Major Categories remain in the black with only Inflation still swimming in red ink. Inflation had been limping along in “mixed” territory month in and month out until PPI FD and Farm Prices, which book-end the monthly calendar, each came in at levels weaker than their multi-month averages pulling that category fractionally further South. The other four reports from the Inflation category were in line with their trends. Consumer, General, Retail, and Services also moved fractionally lower.
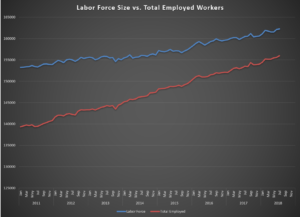
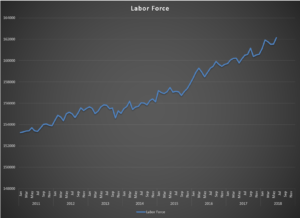
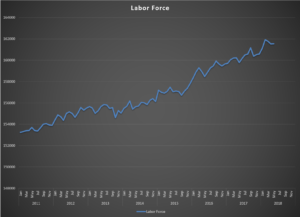
The only real news-makers at all for August were Employment and Manufacturing, where Employment made the only “material” move at .12 to the good. Manufacturing advanced slightly by .04, but the news comes from the Fed/Non-Fed subgroups where in a very unusual and welcome departure from normal the anecdotal heavy Fed sub-group declined, while the hard data Non-Fed subgroup advanced!
The economy is doing great in a vacuum, but the external, non-economic threats to economic health from the second half of the list above are extraordinary. Survey data suggests the cautious tone of an otherwise booming market are based in concerns that the policies producing the high activity are at risk. If we could dispense with some of the noise we’d see an even more robust environment.
The Blue World Jobs Report Analysis will post on Friday morning. We hope to see you there!
Every effort is made to ensure accuracy of data transcription but accuracy cannot be guaranteed. The official release sites should be cross referenced. The index assignments represent the opinion of Blue World Asset Managers, Ltd. who does not warrant or guarantee predictions based on the index.
©Blue World Asset Managers, LTD Tuesday, September 04, 2018