Blue World Jobs Report Analysis 7-2-15

Blue World Employment Situation Report Analysis

Release Date:  Usually the first Friday of each month

Release Site: www.bls.gov

Market Impact: VERY HIGH

Management Value: CRITICAL

Thursday, July 02, 2015

Brain surgery is not rocket science to a brain surgeon©

OUUUUUUUCH

Policy matters, and these don’t work…unless the goal is to continually weaken the American economy.  We need to wake up and realize that 93 million Americans out of work with fewer than 63% of available workers actually participating in the job markets is NOT A RECOVERY!

Last month we were full of optimism and excitement because the report was mixed.  Today…not mixed.  We can’t even say we’re just 0 for June because all the good numbers from April and May were revised down.  June of 2015 has proven to be a blood bath.  Want evidence?…the report is so bad the markets can’t even get excited that a rate hike has just been pushed back yet again.  Just for the record, Matt was about the only voice predicting there would be no rate hike in June when he was on CBS radio in Chicago for the May report.

Usually we need to dive into the deep end of the data pool to find the true weakness in the report, but today all we have to do is wade into the kiddie section.

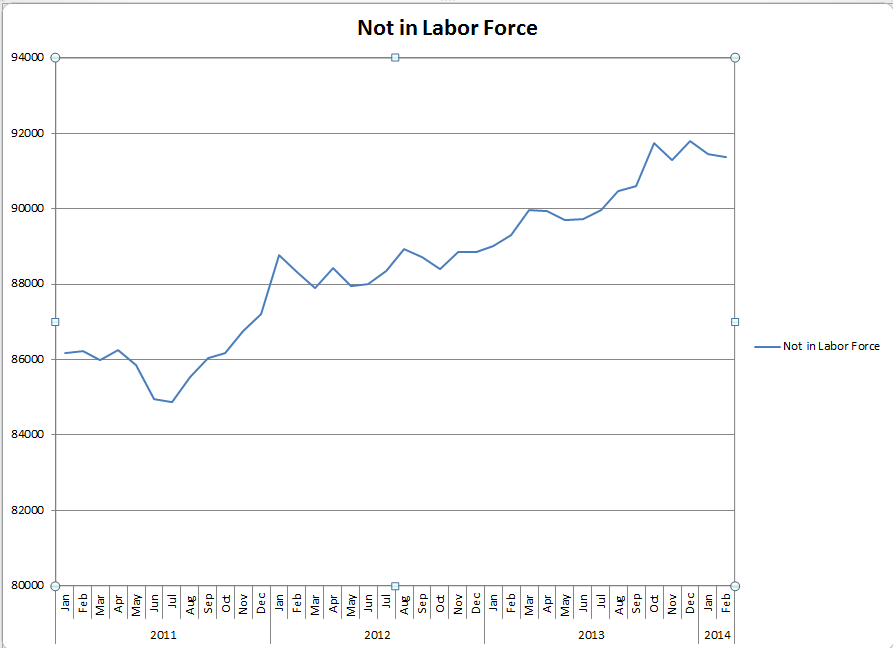
Why did the unemployment rate drop?  Because the number of those in the labor force fell by double the number of new hires, silly!  Yes, 223k net jobs added as the labor force shrank by – wait for it – 432k!  The number of those describing themselves as “employed” was down 56k and those identifying as “not in the labor force” swelled by a staggering 640k.

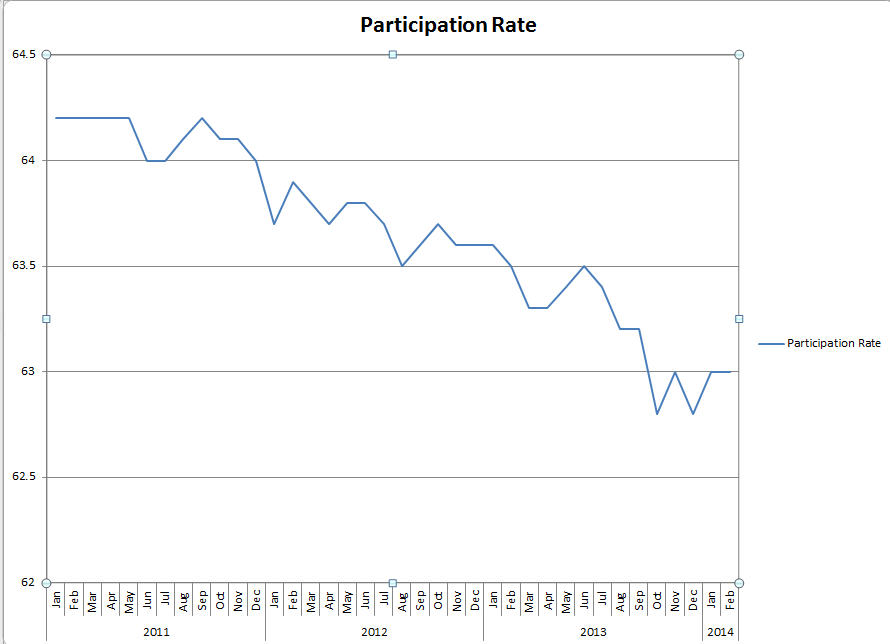
Now, all that is bad but can be summed up by the stat that takes center stage this month.  The participation rate had set and been hovering around an all-time “recovery” low of 62.8%.  June of 2015 saw that floor breached setting a new low of 62.6%.  The chart is included.

Part Rate 6-15

There were 223k net new hires and that is the total private sector as government payrolls ended the month even.  While below the consensus it is still over 200k which is generally respectable BUT…as we said above, downward revisions totaled negative 60k over the last two months, the work week was stagnant again, wages were flat and actually pulled back .3% to an even +2% for the year.

Is there more weak data in the tables to report?  Yes, but we’ve had enough for one day.

Policy matters.  These don’t work.

Thanks for reading and, please, stay tuned…

Release Site: www.bls.gov

Every effort is made to ensure accuracy of data transcription but accuracy cannot be guaranteed.  The official release site should be cross referenced.  The analysis represents the opinion of Blue World Asset Managers, Ltd. who does not warrant or guarantee predictions based on its analysis.

©Blue World Asset Managers, LTD Thursday, July 02, 2015

Blue World Jobs Report Analysis 02-06-2015

Blue World Employment Situation Report Analysis

Release Date:  Usually the first Friday of each month

Release Site: www.bls.gov

Market Sensitivity: VERY HIGH

Management Value: VERY HIGH

Tuesday, March 10, 2015

Brain surgery is not rocket science to a brain surgeon©

SOMEONE forgot to set the office clocks ahead…

We owe two apologies this month.  One is for the tardiness of our analysis and the other is that, well, “analysis” may be giving what we do the benefit of the doubt.  We can reduce this post to mere bullet points because “analysis” becomes unnecessary once patterns are so established as to require nothing more than cursory observation to verify the patterns are intact.  Heck, it’s so simple event the “experts” are starting to get it!  In spite of a “great” number like 295k new jobs, we are hearing “experts” talk about things like participation rate, labor force size, and they’ve even realized there is a data set for the total number of those not in the labor force (who, by the way, are not counted as unemployed)!  Wow, that only took a 6 year recovery to discover…

Here are the bullets:

  • 295k net jobs
  • 288k net jobs in the private sector
  • Participation rate 62.8% (down .1%)
  • Not in Labor Force grew by another 354k
  • Weekly hours flat
  • Weekly hours in manufacturing flat
  • Weekly overtime hours in manufacturing flat

The unemployment rate is irrelevant and no longer a proxy for the health of the economy.  The evidence is building to support the position that a material percentage of the new jobs are going to illegal immigrants and wages are just barely tracking even with inflation.  That last piece is part of the evidence set regarding the illegals.

It’s a mess…and the “experts” appear poised to get it.

We’ll try to be on time next month but in the meantime we hope Spring is springing wherever you are!

Thanks for reading and, please, stay tuned…

Release Site: www.bls.gov

Every effort is made to ensure accuracy of data transcription but accuracy cannot be guaranteed.  The official release site should be cross referenced.  The analysis represents the opinion of Blue World Asset Managers, Ltd. who does not warrant or guarantee predictions based on its analysis.

©Blue World Asset Managers, LTD Tuesday, March 10, 2015

Key Labor Market Metrics 2011 – 2014

Here are the key metric graphs reflecting the annual data with revisions and including the full years of 2011 – 2014.  Revisions were minor and did not alter any of the poor short or long term trends reflected.

Starting at top, left we have the size of the labor charted against the total number of those employed.  We can see as the lines converge the unemployment rate calculation will become smaller even though there is no improvement in the labor force.  This point is validated moving to the right and then below, left showing the participation rate and the number of those no longer in the labor force.  The fact that the graph showing those no longer in the force is rising faster than the total employed line is very unsettling and not recovery-esque. Finally at below, right we see the length of the work week showing a very narrow average over the period.


Graphs - 2011-2015


Blue World Jobs Report Analysis 5-2-2014

Blue World Employment Situation Report Analysis

Release Date:  Usually the first Friday of each month

Release Site: www.bls.gov

Market Sensitivity: VERY HIGH

Management Value: VERY HIGH

Friday, May 02, 2014

Brain surgery is not rocket science to a brain surgeon©

Inigo1

“You keep on using that word.  I do not think it means what you think it means.”

Some of the best job growth of the “RECOVERY!” 

We see sentiments like that all over from the “experts” this morning.  What a great example of why reports need to be analyzed.  The number of new jobs posted was an eye-widening 288k.  That is the best figure in a LONG time.  And then…reality takes over.  For perspective, 288k would be a great number to see early in an actual recovery, but for growth periods (like the one we should be in after 8 or 9 recovery months) it would be quite on the low average side.

Take a look at the futures reaction to the news.  It’s easy to see when they started seeing the details.

Futures after news May 2 2014

We would have expected very little change over the month as there were no momentous economic or policy shifts during April that would inspire a meaningful change, and we are, unfortunately, correct.  So, let’s get to it…

The headline number is 288k new hires for April 2014.  The unemployment rate dropped to 6.3%.  Net revisions to February and March 2014 numbers gives us a net gain of 36k.  That’s the end of the “good” news.

As for the 288k, only 273k are private sector adds.  Of that 273k, 32k are in construction.  That number represents a catch-up spike from the weather driven slowing in the sector.   As before, the rate changed disproportionately to the number of jobs added.  The unemployment rate decline of .4% matches the decline in the participation rate…exactly!  The participation rate fell another jaw dropping .4% in a single month.  It now stands at 62.8%, which you may recall is an all-time record low set back in October of 2013 and repeated in December.  Again, for perspective, had the participation rate remained steady from last month, the unemployment rate would have risen to 6.9%.  288k looks great until we hold it up against:

  • Civilian Labor Force shrank by 806k
  • Number of Employed People fell by 73k
  • Those not in the Labor Force ballooned by 988k

The only other number one could be excited about would be the decline of 733k in the number of unemployed persons, until we realize that the those are the folks who quit looking for work a month ago so they don’t count in the rate calculation.

The length of the work week is stagnant, overtime in manufacturing was unchanged resting at 3.5 hours, earnings are flat and those employed part time for economic reasons continues to rise.

So, we’ve now established and matched the worst labor participation rate in American history three times in the last seven months with over ten million people out of work.

Recovery?

 Vizzini 5-2-142

INCONTHEIVABLE ! ! !  

Thanks for reading and, please, stay tuned…

 Release Site: www.bls.gov

1,2 “The Princess Bride” Act III Communications 1987

Every effort is made to ensure accuracy of data transcription but accuracy cannot be guaranteed.  The official release site should be cross referenced.  The analysis represents the opinion of Blue World Asset Managers, Ltd. who does not warrant or guarantee predictions based on its analysis.

©Blue World Asset Managers, LTD Friday, May 02, 2014

Blue World Jobs Report Analysis 03-07-2014

Blue World Employment Situation Report Analysis

Release Date:  Usually the first Friday of each month

Release Site: www.bls.gov

Market Sensitivity: VERY HIGH

Management Value: VERY HIGH

Friday, March 07, 2014

Brain surgery is not rocket science to a brain surgeon©

Sure, we could sequence copy/paste from last month and call it a day, but if we did that we’d ignore some really high quality comedy!  The weather?  REALLY? THE WEATHER?  This is another absolutely miserable report, but don’t worry, the experts say it’s just due to the weather.  Ya know, the really brutal winter… Asking people who invest real money and employ real people to believe that is asking them to believe that the winter of 2014 began in August of 2007!  We certainly understand the need to spin this as best as possible for political and keep-the-rank-and-file-in-the-market reasons, but we’re here to help those who seek to exert a positive impact on the economy.  We do this by offering an analysis that allows decisions to be based on reality.  How many times can we say it – We can’t make the labor market stronger by making the labor force smaller!

You just can’t beat this math phenomenon.  Last month we added 145k jobs and the unemployment rate “improved.”  This month we add 162k, and the rate gets worse!  The “improving” unemployment rate has been due to the problem of a positive denominator outpacing a stagnant numerator.  This month that was slightly reversed, as it has been on occasion, but as you’ll see in the graph below it’s the same old pattern.  It continues to provide us an artificially low and misleading unemployment rate that can be utilized for headlines but has absolutely no value for investors and business managers. 

I know they are reporting 175k new positions, but that includes government jobs.  To measure the economy we only care about hires in the private sector, and there we added only 162k new payrolls.  The participation rate held at 63% in February 2014 which remains in all-time record low territory.  The work week pulled back and remains range bound.  What struck us, however, is that it is three tenths of an hour shorter than a year ago.  That’s significant.  There were noticeable work week decreases in the sector-by-sector analysis including overtime hours in manufacturing, which has now been trending downward for the last four months.  The largest declines were noted in construction hours, which is really the only place we can blame the weather at all.  Wages remain uninspiring across the board and those who are at least 25 years old holding a Bachelor’s degree or better are unemployed at a rate of 3.4% in February 2014.  That number has been on the rise of late and remains in historically unseen territory, the last six years notwithstanding. 

Like we always say, one report is never valuable unto itself.  Trends are important.  There are a multitude of other stats we could cite from this report, but they are predictable and redundant at this point.  Instead we offer the following updated graphs to show what we silly non-experts already knew…nothing’s changed!

Thanks for reading and, please, stay tuned…

Feb Force vs Employed

Feb Part Rate


Feb Not In Force


Release Site: www.bls.gov

Every effort is made to ensure accuracy of data transcription but accuracy cannot be guaranteed.  The official release site should be cross referenced.  The analysis represents the opinion of Blue World Asset Managers, Ltd. who does not warrant or guarantee predictions based on its analysis.

©Blue World Asset Managers, LTD Thursday, March 06, 2014