Blue World Jobs Report Analysis 02/03/2017

Blue World Employment Situation Report Analysis

Release Date: Usually on the first Friday of the month

Release Site: www.bls.gov

Market Impact: Usually Very High

Management Value: Critical


Friday, February 03, 2017

Brain Surgery is not Rocket Science to a Brain Surgeon©


Kramden Basic


OOHHH, WHAT A SURPRISE!


… but not for the reasons the “experts” think. We’ll explain.


This White House seems to be working fast, but nobody’s that fast. In other words, don’t look for this to anchor a gigantic new trend quite yet. The real surprises for those who invest real money, manage real businesses, and employ real people are in the details. We’ll point them out.

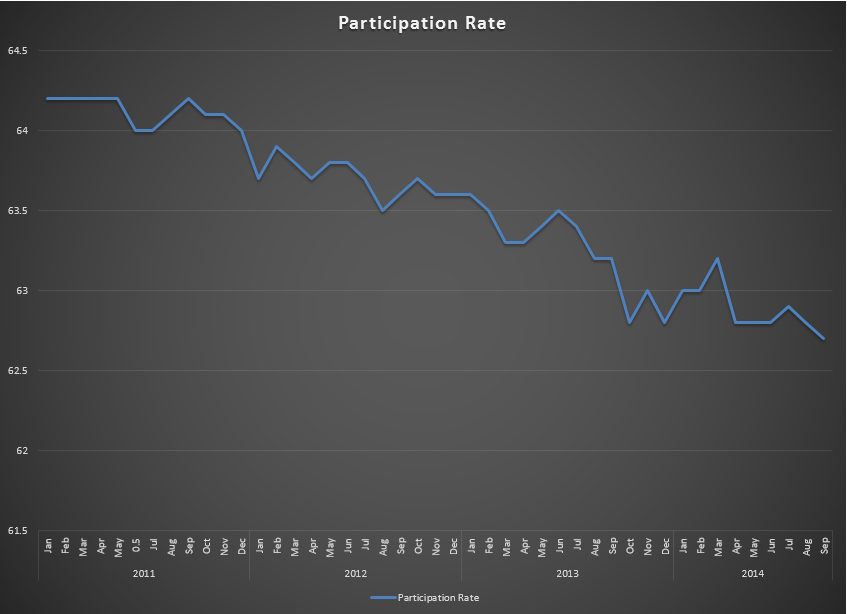
To start, the total Unemployed grew by more than the total Labor Force, but both were positive numbers and widened the spread, so the Unemployment Rate (who cares) ticked up and that was a good sign in this case. As we’ve said, the Unemployment Rate is no longer a reliable proxy for the actual health of the Labor Market. The Participation Rate ticked up .2% to 62.9%. That is still horrible, BUT… that stat usually moves .1% at a time. When we’ve seen bigger moves they have typically been in the wrong direction, so a .2% move to the North is a welcome departure.

The real surprises? OK. We always point out the headline number is never the one we care about because it includes both Private Sector and Government hires. We only care about the Private Sector when analyzing the economy, and we have been accustomed to writing about the Private Sector totals being lower that than the headline tally. If you’re new to this report or just missed last month, we describe this in some detail here. The three-month revisions to the Private Sector numbers netted us plus 1k jobs. The Private Sector net total for January was 237k, 10k higher than the 227k headline, because the Government shrank its workforce by 10k. That’s before the hiring freeze was completely in effect. Another surprise was the accuracy of the ADP report. Their number was only 9k off of today’s BLS. Believe us, that is a surprise. The counting methods of the two reports are so different that the ADP report usually gives a hint of direction but not such tight agreement in totals. The really big news, however, is with regard to the Not in Labor Force totals. For the last two months we have been over the 95M mark, and that is staggering. Remember, these people are not counted as “unemployed” in calculating the Unemployment Rate because they have not looked for work recently. This is why we hear people talk about the true unemployment rate, which is still double digit, if we include the NILF in the unemployed count. That number fell by three-quarters of a million people last month! We don’t recall that kind of a drop in a single month. That number is confirmatory of several important indicators. First, it validates the big jump in the Participation Rate as non-participants are re-entering the labor market. Why? Because, suddenly, they have renewed optimism that jobs will be available. This is also confirmatory of the Consumer and business outlook metrics followed by the Blue World Economic Index®, all of which cite positive outlooks by consumers to find work and businesses to offer work.

No positive change was ever precipitated by pessimism, as demonstrated in the last eight years. We do not make political statements through these reports. We don’t care what works, as long as it works. And by “works” we mean policy creates an environment conducive to economic expansion through private sector enterprise growth. Period.

All that said, don’t get crazy. This is just one report, a single data point. Unto itself it means virtually nothing. Policy needs to be implemented as advertised, have a chance to bear fruit, and adjustments made if needed. That takes time. We estimate Q3 before we have the earliest pattern indications of what this will all mean so hang in there and we’ll see you back here at month’s end for the Blue World Economic Index® report.


Thanks for reading, and please stay tuned…


Release Site: www.bls.gov


Every effort is made to ensure accuracy of data transcription but accuracy cannot be guaranteed.  The official release site should be cross referenced. The analysis represents the opinion of Blue World Asset Managers, LTD. who does not warrant or guarantee predictions based on its analysis. 
©Blue World Asset Managers, LTD Friday, February 03, 2017

Blue World Economic Index® for September 2016

Brief Explanation 


Blue World Economic Index®

Scale: -2 to +2

Release Date:  Usually the first Business Day of Each Month

Release Site: www.blueworldassetmanagers.com

Management Value: Critical

Friday, September 30, 2016

The following will, at first, seem out of place for this report, but we feel strongly that a distinction needs to be made particularly for our “expert” friends in the regular media. We feel the inclusion will be sufficiently elucidated and justified in paragraph 2.


protester

Protesters


rioters

Rioters


In an election year the economy is usually high profile, but domestic riots, terrorism, and illegal immigration are taking center stage for very good reason. The problem, of course, is that those things impact the economy in very profound ways. September 2016 is a tragic example of how profound it can be. As viewed through the eyes of an entrepreneur, business owner, and investor of real money (that means outside the markets), September 2016 set an all-time record low for the Blue World Economic Index®.

The composite landed at -.45, with deterioration in six of eight major categories. As we head for November we humbly submit that the result of the last eight year’s policy positions is well documented. If sub 3% GDP, sub 64% employment participation rate, and stifling regulation and taxation are your managerial success accelerators then the choice is clear. If not, equally clear. For those missing our leanings we suggest this is a case where unknown is preferable to known.

Every effort is made to ensure accuracy of data transcription but accuracy cannot be guaranteed.  The official release sites should be cross referenced.  The index assignments represent the opinion of Blue World Asset Managers, Ltd. who does not warrant or guarantee predictions based on the index.
©Blue World Asset Managers, LTD Friday, September 30, 2016


Blue World Jobs Report Analysis 7-2-15

Blue World Employment Situation Report Analysis

Release Date:  Usually the first Friday of each month

Release Site: www.bls.gov

Market Impact: VERY HIGH

Management Value: CRITICAL

Thursday, July 02, 2015

Brain surgery is not rocket science to a brain surgeon©

OUUUUUUUCH

Policy matters, and these don’t work…unless the goal is to continually weaken the American economy.  We need to wake up and realize that 93 million Americans out of work with fewer than 63% of available workers actually participating in the job markets is NOT A RECOVERY!

Last month we were full of optimism and excitement because the report was mixed.  Today…not mixed.  We can’t even say we’re just 0 for June because all the good numbers from April and May were revised down.  June of 2015 has proven to be a blood bath.  Want evidence?…the report is so bad the markets can’t even get excited that a rate hike has just been pushed back yet again.  Just for the record, Matt was about the only voice predicting there would be no rate hike in June when he was on CBS radio in Chicago for the May report.

Usually we need to dive into the deep end of the data pool to find the true weakness in the report, but today all we have to do is wade into the kiddie section.

Why did the unemployment rate drop?  Because the number of those in the labor force fell by double the number of new hires, silly!  Yes, 223k net jobs added as the labor force shrank by – wait for it – 432k!  The number of those describing themselves as “employed” was down 56k and those identifying as “not in the labor force” swelled by a staggering 640k.

Now, all that is bad but can be summed up by the stat that takes center stage this month.  The participation rate had set and been hovering around an all-time “recovery” low of 62.8%.  June of 2015 saw that floor breached setting a new low of 62.6%.  The chart is included.

Part Rate 6-15

There were 223k net new hires and that is the total private sector as government payrolls ended the month even.  While below the consensus it is still over 200k which is generally respectable BUT…as we said above, downward revisions totaled negative 60k over the last two months, the work week was stagnant again, wages were flat and actually pulled back .3% to an even +2% for the year.

Is there more weak data in the tables to report?  Yes, but we’ve had enough for one day.

Policy matters.  These don’t work.

Thanks for reading and, please, stay tuned…

Release Site: www.bls.gov

Every effort is made to ensure accuracy of data transcription but accuracy cannot be guaranteed.  The official release site should be cross referenced.  The analysis represents the opinion of Blue World Asset Managers, Ltd. who does not warrant or guarantee predictions based on its analysis.

©Blue World Asset Managers, LTD Thursday, July 02, 2015

Employment Situation Report Analysis 10-03-2014

Blue World Employment Situation Report Analysis

Release Date:  Usually the first Friday of each month

Release Site: www.bls.gov

Market Sensitivity: VERY HIGH

Management Value: VERY HIGH

Friday, October 03, 2014

Brain surgery is not rocket science to a brain surgeon©

Records were made to be broken, but as we all know some records are the last ones you want to be the one to break. 

play_a_prairieviewplayers_576_crop_north


Source: espn.go.com from an article in Bleacher Report at http://bleacherreport.com/multiple-sports

As the “expert” world cheers, Blue World cries FOUL!!”

80 consecutive losses as a football team may be an embarrassing record to hold, but the record this administration broke in September 2014 is far worse than just embarrassing!

Wow!  This report is worse than last month’s, but it will be hard to break through the manic headlines to find the truth!

Occasionally we’ll need to remind readers that the jobs report number has been politicized.  Here’s a Forbes article that echoes Blue World’s analysis following a new BLS chief appointment and a fraudulent drop in unemployment to below 8% just before the 2012 election.  Cynical?  Absolutely, but not in this case.  The mathematical proof is in the BLS pudding.  Fewer jobs equals an improved unemployment rate, and more jobs has yielded a deterioration in the rate?  Not to mention that the number of new jobs published in those situations could NEVER cause an honest rate calculation to move that much.  How do they do it?  There are lots of tricks they can used to “cook” the headline numbers, but the truth is still hiding in the weeds.  Why is the truth allowed to survive in there?  We suspect it’s not because they can’t fudge the details.  We think it’s just because they figure so few pay attention to them that it doesn’t matter.  Unfortunately, they’re correct.   That’s why you, the astute manager and investor, follow us to know what’s really going on.  As Matt said on CBS Radio last month, the unemployment rate has lost all credibility as a proxy for the health of the labor market.  Here’s a link to the podcast of that show.  This month is no less a fraud on the managing, investing and voting public.  Let’s look at why that’s true…

248k new jobs.  Great!  Of those, however, only 236k are in the private sector which keeps us well below our 250k requirement to just break even on those becoming eligible to work each month.  The labor force lost almost 100k more members in September 2014 and those not in the labor force swelled by 315k.  Yes, 315k.  So, 236k new jobs…and 315k left the labor force.  See the fraud yet?

The work week remained range bound at just 34.6 hours but construction hours fell by .2 hours.  That’s big.  It’s also the second worst showing of 2014.  Hourly wages actually declined.

Without fully detailing a diffusion index, we’ll just say here that readings over 50 point to expansion and those under 50 show contraction.  Consider the uncomfortable three-month trend in the manufacturing sector’s diffusion index starting in July: 56.2, 54.9, and 51.9.  That’s not pretty.

All that would be bad enough, but there is one glaring statistic that you will see here and from very few other responsible analysts…the participation rate.  Ladies and gentleman, the available, eligible labor force for the United States of America has set a NEW RECOVERY RECORD LOW PARTICIPATION RATE in September of 2014!  For those of you keeping score, that’s 5 years, 3 months into a “RECOVERY!”  The participation rate has fallen to 62.7%, a level not seen since 1978.  The sad chart is included below.

9-14 Part Rate

We say ignorance is curable but stupid is forever.  So let’s leave ignorance out of the equation and focus on stupid, then ask what’s worse; stupid or dishonest?  We say “stupid AND dishonest!”  The participation rate is low because baby boomers have done so well that they can afford to retire early especially since they have access to affordable healthcare under Obamacare?!!?  We’re not kidding!  You have to go and read the comments under this article from Business Insider.  It is UNBELIEVABLE!  Sometimes calling someone “stupid” is an insult…to stupid people.

Business owners, managers and investors everywhere need to be aware of the realities of this economy.  Our governmental leaders are out there telling us the economy is fine and improving.  They tell us their policies are working and we are just too ignorant to see it.  Believing this rhetoric is nothing short of dangerous to our economic health!

So, as always, thanks for reading, keep the defense on the field, and for management and investment sake please, stay tuned…

Release Site: www.bls.gov

Every effort is made to ensure accuracy of data transcription but accuracy cannot be guaranteed.  The official release site should be cross referenced.  The analysis represents the opinion of Blue World Asset Managers, Ltd. who does not warrant or guarantee predictions based on its analysis.

©Blue World Asset Managers, LTD Friday, October 03, 2014

Blue World Jobs Report Analysis 8-1-2014

Blue World Employment Situation Report Analysis

Release Date:  Usually the first Friday of each month

Release Site: www.bls.gov

Market Sensitivity: VERY HIGH

Management Value: VERY HIGH

Friday, August 01, 2014

Brain surgery is not rocket science to a brain surgeon©

We are sending this postcard to the Experts who are cheering the last 2 month’s reports.

Earth Post Card for 8-1-14


Yep, another world beater! 

We took July 4th off and didn’t post a report.  We wrote it for the sake of data, but we figured if we didn’t feel like reading it on the 4th of July, you wouldn’t either.  Unfortunately one could read the June post and/or this one and not have missed a thing.  This is starting to feel like a soap opera in that once we know the characters we can step away for months, watch one episode and be completely back up to speed.

Will the markets like it?  Who knows (or cares)?  There has been a fundamental shift in market behavior away from economic fundamentals to a focus on government action; so who cares how they take it?  We’re concerned with providing actionable intelligence to the small and mid-sized businesses out there who provide the engine for our nation’s economic growth.  In other words, we care about reality in the real world …you know…as opposed to Planet Cubicle where the experts live, work, and analyze data!  What does the real world think of this report?  The real world knows it remains terrible. 

Now that the qualitative pre-amble is over, let’s quantify “terrible.”

Last month’s 298k was actually 270k when we subtract the additions to government payrolls.  That 270 would still be a respectable number early in a recovery!  The unemployment rate decrease last month was our usual phenomenon of the labor force line and unemployed line moving in opposite directions.  That’s how we continue to claim the headline rate as reported is bogus and that position is validated by a participation rate graph that continues to make lower highs and lower lows.

Those things remain true for July.  There were only 198k new jobs once we net the private sector with government hires.  But guess what?!!  The number of those unemployed also grew by…wait for it…197k!  The rate ticked up by a tenth, but again, who cares about the rate anymore, especially as the participation rate remains in all-time record low territory at 62.9%.  25+ with a B.A. or better are STILL unemployed at rates over 3%.  The Not In Labor Force row from table A tells us there are 92M Americans who didn’t even look for work in the past month.  That number is a staggering 2M more than there were a year ago.  There were big increases in the number of those out of work for 1 to 14 weeks.  In fact, that number alone nearly eclipses the total of new hires for the month.  The length of the work week for all employees has not changed in three months while manufacturing hours and overtime both fell posting their worst numbers in the same time period.

Wages?  Meh.

So, to all our experts out there who exclaimed “yippee” on the BLS release dates for June and July of 2014, wish you were here!

Thanks for reading and, please, stay tuned…

Release Site: www.bls.gov

Every effort is made to ensure accuracy of data transcription but accuracy cannot be guaranteed.  The official release site should be cross referenced.  The analysis represents the opinion of Blue World Asset Managers, Ltd. who does not warrant or guarantee predictions based on its analysis.

©Blue World Asset Managers, LTD Friday, August 01, 2014