Why Does Blue World Keep Saying The Labor Market is Not Improving

Blue World Employment Situation Report Analysis

Release Date:  Usually the first Friday of each month
Release Site: www.bls.gov

Market Sensitivity: VERY HIGH
Management Value: VERY HIGH
Monday, December 05, 2011

Ignorance is curable. Stupid is forever.©

We’ve been getting a lot of requests for additional explanation of why we continue to say the labor market is still struggling and there is no meaningful economic recovery going on in spite of the headlines trumpeting a lower unemployment rate.  It is quite simple, as we maintain all things are, and easily  demonstrable with the cool multi-colored graphs to follow.  Before that, however, a brief primer on how the unemployment rate and the number of jobs created are derived would be helpful.

There are two sources that are used.  The vulnerabilities of each will be readily apparent.  No surprise that the biggest vulnerabilities lie in the human element.  They include the need for respondent compliance and honesty plus governmental estimates necessitated by the counting methods.  For example, if one has not actively sought work within the past four weeks they are not counted as a member of the labor force.  While they attempt to account for this stat in a different table of the report you can see it requires a degree of “estimation.”  What might influence those “estimates?”  Not sayin’.  Just sayin’.

The absurdity of wild market gyrations in response to each month’s release cannot be overstated.  No single report is valuable in a vacuum.  Only a study of trends makes the data meaningful.  Even more, it’s not just a trend in the headline numbers.  As we will see, trends in the headline unemployment rate need to be supported by trends in the underlying detail because the unemployment rate can be misleading as in the current case.

The headliner unemployment rate and new jobs created reported in the media is virtually useless to investors, business leaders and strategists without the underlying detail to give it meaning.  The unemployment report is touted as a leading or lagging economic indicator depending on what is politically expedient at the time.  The truth is that the report is full of leading (predictive) and lagging  data.  In our monthly analysis posts we always offer a look into some of that detail to find out what just happened, what is happening and what is likely about to happen.  This is where the actionable information hides from the headlines.  This is where we go to drive informed decisions.

The Report:

As we said, the report is based on two main bodies.  They are the Household Survey and the Establishment Survey.  Each of these bodies has break-out tables that drill down into the headline data.    

Body 1 (Table A) is populated with data gleaned from the Household Survey.  As the name implies surveys are sent (or called in) to households across the country and solicit information about the employment status of people in the home.  The reported unemployment rate is derived from this survey.  Divide the number of unemployed people 16 or older by the total number of available workers (civilian labor force) and we’ve got our unemployment rate.  Response to this survey tends to be a very high percentage of surveys returned in a very short time so revisions to this body of the report are rarely necessary.  That is also why it is a leading indicator of economic direction.  Technology allows companies to see and react to softening or firming demand for their products or services much faster than in eras past.  They tend to react by cutting or adding staff before the official onset of or emergence from a recession making any identifiable 3 or 4 month trend a pretty reliable indicator of the direction of the economy.

Body 2 (Table B) data is gathered via the Establishment Survey.  This survey is sent directly to businesses in order to gather information about the size of their payrolls.  More employees on the payroll than the prior month means new jobs were created.  Fewer employees getting a check means jobs were lost.  It’s that simple. The establishment survey does not include farm workers, the self employed or domestic help.  As such, it is the most direct measure of hiring and firing by firms.  That’s why it is considered the more valuable metric for policy makers, business managers and investors and usually has the bigger impact on the stock markets.  This tends to be a lagging indicator because companies are slow to add to payroll until they’re sure an upturn has legs.  As such, for confirmation we look at average weekly hours worked and overtime, as an example of detail.  These would be considered leading indicators because the data shows what is happening right now.   If we see trending increases here it is a decent bet that new job creation is on the way.

We Can’t Claim an Improved Labor Market by Making the Civilian Labor Force Smaller

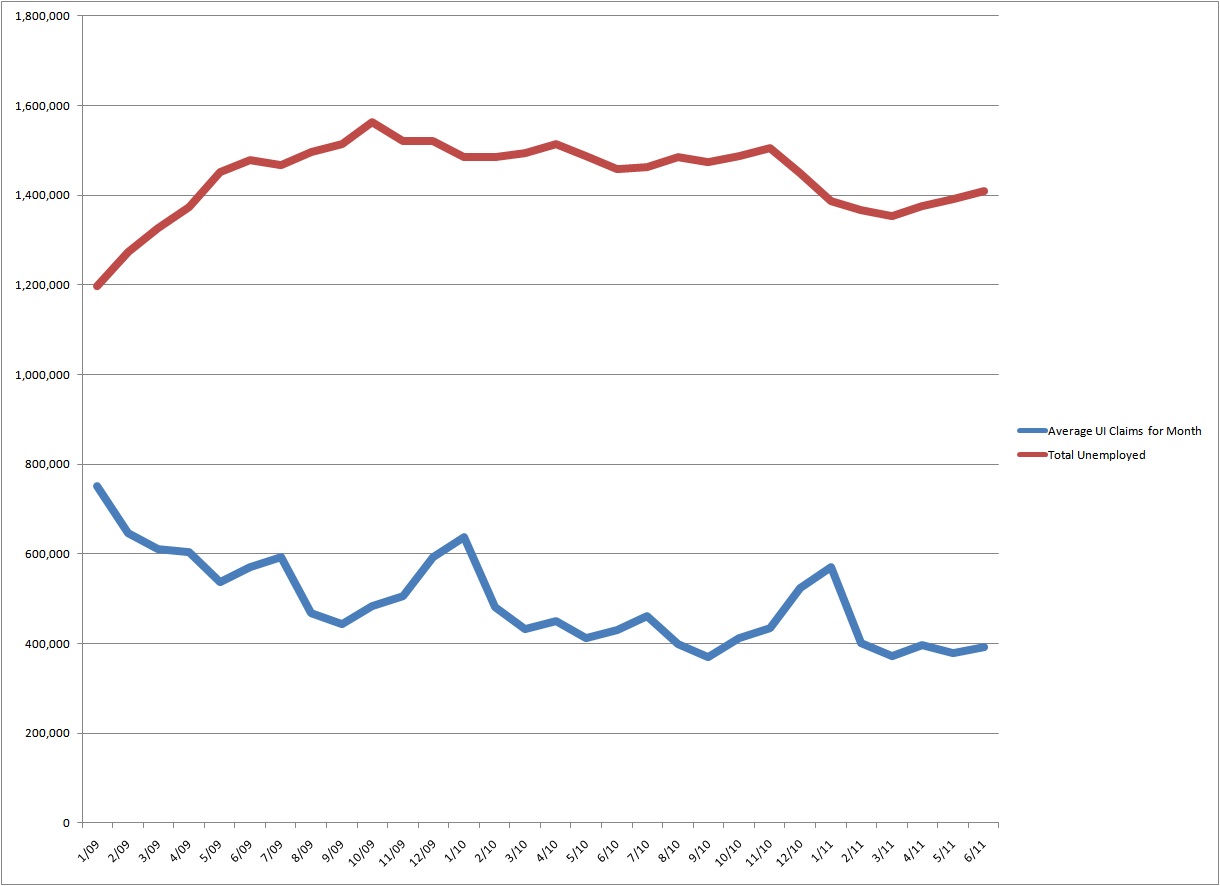
So, armed with that understanding let’s look at some trends relative to last week’s headline drop from 9% to 8.6%.  As the graph shows, not only do we lack a trend, the headline unemployment rate indicates what Blue World continues to describe as an economy just bouncing along in neutral waiting for an incentive to pick a direction.  In addition, the rate drop appears unrealistic relative to other month-over-month changes for the past year.

So, to check the validity of the “improving” status we look to hours worked per week and overtime hours per week in manufacturing.  Through November of 2011 the average in manufacturing has been 41.3 hours worked per week with a range of 41.1 to 41.5 hours.  In order for the job market to be looking up we want to demonstrate a three to four month trend of 41.5+ hours.   We need to see overtime hours average over 4.5 hours per week for three to four months as well.   Through November of 2011 we have averaged 4.1 hours with a range of 4.1 to 4.2.  Additionally, the diffusion index in manufacturing stands at 49.4.  That means that less than 50% of manufacturing firms have expanded payrolls.  For comparison it was a much better 58 in Nov 2010 and has trended down to the current for the last three months.  You can start to appreciate how valuable the monthly jobs report detail can be in eliminating surprises from the quarterly GDP report!

OK, so, with all that doom and gloom how did the headline unemployment rate fall a ridiculous .4% in a single month?  Simple.  We made the work force smaller and the number of payrolls bigger.  That’ll getcha a smaller percentage every time!  Below is a graph showing the size of the civilian labor force the number of employed people and the year end unemployment rate for the last four years.  All graph data are sourced from www.bls.gov.   2011 is year to date November.

As you can see the detail of hours worked in manufacturing (and some other detail) do not support the notion that the labor market is improving because it’s not!  Making the workforce smaller does not an improving labor market make.  I think it’s clear that a truly recovering economy will show a decreasing unemployment rate in spite of an expanding labor market.  In other words we need the number of people getting jobs to outpace the expansion of the labor force.  It is estimated that we would need 150,000 new jobs each month just to break even right now.  We just haven’t seen those kinds of numbers in the Establishment Survey.  It’s been a consistent pattern of blips and dips.


A comparison of the three graphs shown above demonstrates the phenomenon within 2011.  The unemployment rate was relatively stable between April and September as changes in the employed and labor force size moved in the same direction and at similar rates.  Then in November we see a sharp increase on the employed graph and a simultaneous sharp decline on the work force graph.  The unemployment rate graph predictably reflects the phenomenon.

Try as they might the U.S., and world leaders for that matter, would do well to learn that politics cannot replace supply and demand as drivers of economies.  With stagnant work week length and corresponding personal earnings the demand cannot return.  Until confidence drives demand, and demand drives the need for workers, this pattern will continue or deteriorate.  Economics don’t get simpler than that.  A record number of Americans are now on some sort of government assistance.  That has never and will never improve confidence.  It is a boon, however, to those seeking to create dependence.

So, what happened to all those folks who disappeared from the civilian labor force?  Did they quit looking for work,  stop responding to the surveys or were they, perhaps, “estimated” out of the count?  Even if they didn’t make the report this time we are fairly sure they’re still out there so  one thing we, and now you, can say for certain is that eventually they’ll show up…and when they do the RATE WILL CHANGE! 

Most recent Blue World Jobs Report analysis at:

http://owl.li/7QULH

Thanks for reading.  We hope this helped and, please, stay tuned…

Employment Situation Summary Release Site: www.bls.gov

Every effort is made to ensure accuracy of data transcription but accuracy cannot be guaranteed.  The official release site should be cross referenced.  The analysis represents the opinion of Blue World Asset Managers, Ltd. who does not warrant or guarantee predictions based on its analysis.

©Blue World Asset Managers, LTD Monday, December 05, 2011

The Confusion Suffered by “Experts”

Tuesday, August 16, 2011

Brain surgery is not rocket science to a brain surgeon.©

The Confusion Suffered by “Experts”

We are being asked a question pretty routinely lately.  In our Tweets and our blog posts we always exhibit an enthusiastic irreverence for certain economists, market commentators, media personalities and politicians by identifying them as “experts.”  We go on to explain why what they said was silly.  We have little use or respect for those whose headlines routinely contain words like “unexpected”, “surprised”, etc.  We often review our past posts regarding our opinions on where the economy is headed to make sure we have had a good handle on what is going on or if we need to shift our observational and analytical methodology.  Ya see, “experts”, that’s what you do if your analysis, decisions and policy aren’t working.  We are pleased yet sad to say if you follow us none of the economic data that “surprises” the “experts” is ever a bombshell for you.  This has led many of our readers to ask Why are the “Experts” Always Wrong?

There are several reasons ranging from academically focused and financially motivated to politically goaded.  In other words we must always consider the source.  The financially and politically motivated crowd is, we believe, reasonably small.  Advocates of the party in power will try to up-spin data and market beneficiaries have a vested interest in making any news look as good as possible.  That leaves a much larger group that is just plain wrong.  Why are these “experts” so easily misguided by the same data we review?  We have a theory.  The problem is mostly academic.  Blue World employs people.  Blue World principals and network resources employ lots more people.  Blue World clients employ lots, lots more people.  Decisions on how many are employed is partially based on a comprehensive review of the economic data released, just like many of our “experts.”  The difference is we HAVE EMPLOYED REAL PEOPLE and INVESTED REAL MONEY to make businesses (our own and our client’s) successful in the private sector.  We don’t just sit in cubicles and read data.  We compare the data to what we see happening around us in the real world.  Just driving  around town or across the country and taking note of strip mall vacancies can give some great anecdotal corroboration or refutation of the spin in the headlines. 

Data is just that.  Data.  It should be used as a metric against which to measure reality.  If we don’t understand how the data is gathered we are likely to make poor decisions based on it AND be at the mercy of those who do know and choose to ‘spin.’  For example, the unemployment rate dropped .1% last month.  Good news, right?  Not if we know how to read the report.  The number of unemployed people actually rose but the sample size changed such that the number of people being counted shifted. This created an artificial improvement the percentage even though reality worsened.  This is an observation, not an accusation, but I’m afraid there is a degree of estimating that goes into the BLS Unemployment numbers, and that creates the opportunity to mislead at the headline.  That’s why Blue World does the monthly analysis, to remove the spin and provide actionable intelligence to business owners, managers and investors. 

Another example: a great deal of predictive emphasis is placed on the ADP job numbers.  As the largest payroll processor in the company it is assumed that an increase in processed paychecks equals positive private sector job growth.  The problem is that ADP counts all payrolls, not all workers.  In other words one worker may be holding down three part-time jobs because he can’t find full time employment.  This looks like three new jobs but it is only one person working!  This statistic is not accounted for in the ADP report but is in the BLS release.  It is called “Employed Persons at Work Part-Time for Economic Reasons.” “For Economic Reasons” means a worker wants full time work but can’t find it.  It is found in Table A: Household Data of the monthly BLS report.  If we see a rising trend in the ADP report and want to deduce good or bad news from it we must compare that to the trend of part-timers for economic reasons.  If that trend is also rising we don’t have a good trend for private sector employment.

We did a blog some time ago that shows how all of the economic reports out there have just one common goal.  They all seek to determine what our mood is.  That’s really it.  The full post is entitled Is There a Meaningful Economic Recovery Going on Out There? and can be found at http://ow.ly/4M2Dn It shows what we predicted for the economy over a year ago.  Sometimes it’s no fun to be right.   The most relevant passage to this post follows:

Now, there are boatloads of economic releases that come out each week, month, quarter, year.  There is GDP, the unemployment report, housing starts, consumer confidence index, new home sales, existing home sales, new housing permits, first-time jobless claims, factory orders, manufacturing index and on and on and on… What I want you to realize is that for all the data gathered, analyzed and reported on they all have just one common objective.  It is to see what kind of mood you and I are in as consumers.  If we can determine what kind of mood the consumers are in and what their spending patterns are we can predict which way the economy is likely headed.  If unemployment is headed down, personal income is increasing and GDP is rising it is a darn good bet that good times are-a-comin’.

Often times spin of the data is used to try to shape our mood rather than identify it.  Those who read the detail (or our analysis) are inoculated against such manipulation. 

So how are the truly unbiased “experts” fooled?  We have data that comes out weekly, like first-time unemployment insurance claims; monthly, like the Bureau of Labor Statistics (BLS) employment report; and quarterly, like the Gross Domestic Product (GDP) report.  All too often our “experts” use the weekly type releases as predictors of the longer term data.  The correlation during robust recovery and distinctly weakening times can be quite good.  At times of bouncing along the bottom or flying at cruising speed, however, the predictive value predictably deteriorates!  If all you do is sit in a cubicle and look at data (like our “experts”) you’re just going to be wrong due to the inconsistent and sometimes volatile nature of the more short term data.  To illustrate this point the graph below shows the average number of new unemployment insurance claims (weekly) graphed against the actual number of reported unemployed people (monthly) divided by 10 to match the scale. 


Source: www.bls.gov & www.dol.gov

As you can see, if you were to use even the weekly average new claims (blue line) to predict the unemployed totals (red line), you would regularly be “surprised.”  If you were to look for news, good or bad, in the actual weekly numbers you can appreciate that they are even more volatile and unpredictable than the smoothed-out average represented above.  That’s why we roll our eyes and shake our heads when the markets throw a party or a wake every Thursday when the new unemployment insurance claims are announced. 

Any one week, month or quarter’s data does not tell us anything in a vacuum.  Convincing medium to long-term trends coupled with real-world observations ranging from personal income and internal sales to store front vacancies and the mood of our neighbors are the only way to accurately assess the true health of the overall economy.  This type of ongoing observation and analysis of DATA AND THE REAL WORLD is the only way responsible investors, employees, managers and owners (remember that managers and owners are also employees) make decisions about their businesses.  We say brain surgery is not rocket science to a brain surgeon. I am certainly neither.  But even I can predict 9% unemployment, record foreclosures, rising food and gas prices, historically low interest rates, unfathomable Federal debt, ubiquitous commercial vacancies and an ever-weakening dollar do not add up to a recovering economy!  This is why I, and I suspect you, will NEVER be an “expert.”

© Tuesday, August 16, 2011Blue World Asset Managers


There is no such thing as a jobless recovery!

Monday, August 1, 2011

Ignorance is curable. Stupid is Forever©

There is no such thing as a jobless recovery!

There is Nothing “Wrong” with America’s Job Engine.  It’s Just Starved for Fuel

“What’s Wrong with America’s Job Engine?” Our Author asks.

Please read: http://owl.li/5QtoQ

Our response follows:

It’s hard to know where to begin with this one.  How about here?  There is no such thing as a jobless recovery!  Jobless recovery is an oxymoron.  If we are “jobless” we don’t have a recovery.  It’s as simple as that.  A full seventy percent of our GDP is driven by consumer spending.  If unemployment is nine percent, and rising, where is the recovery?  We keep telling you there isn’t one, the recession is not over and the economic data continue to bear that out.  Consider the ridiculous “expert” driven GDP estimates.  The first quarter was revised down from 1.9% to .4%.  Then they have the nerve to suggest the second quarter at 1.3% (advanced estimate which will also be revised) was “unexpected.”  These guys have a better job than weather forecasters!

Of course CEO’s see no demand out there.  Did we mention unemployment is over nine percent and the consumer drives GDP?  GDP is a great proxy for demand so you can see it takes very little ‘smart’ to predict demand will continue to be low.

The author asserts that while output, profits and the labor force have grown over the past ten years the number of  employed people (jobs) has fallen.  They say you can get numbers to say anything…  Those assertions are utterly ridiculous as the graphics below will show.  The number of unemployed people has not followed the output earnings trend for ten years.  The unemployed have become so in the last two and a half years!


                                                                                                                                                                                                             Source: www.bls.gov

As you can see, after 2002 the number of unemployed workers actually decreased while the available  labor force increased.  It is only since mid 2007 that the rate of unemployed people has out accelerated the increase in the labor force.  Hard to deny policy and anticipation of policy affects economic activity.

To say that sales have come back as a general statement is moronic no matter who says it.  Can it be true in narrow examples?  Sure.  But we again refer you to the .4%/1.3% GDP numbers from today.  Sales HAVE NOT returned.

Construction and small business are not failing to hire early in the recovery because THERE IS NO RECOVERY.  They were not “crippled by the credit bust.”  They were, are and will continue to be crippled by a lack of demand…PERIOD.  The “confidence” factor referred to by the author is based on…anticipation of sustained DEMAND, DUH.

There is no “phenomenon” regarding a change in the way employers view labor no matter how many pointy headed “experts” in cubicles who’ve never signed a paycheck say there is.  Business has always strived to keep costs as low as possible.  That’s responsible management and always has been.  Nothing new.  But as technology advances the ability to do more with fewer humans continues to accelerate.  Does this support the author’s conclusion that technology is part of the “problem?”  NO!  All that technology has to be designed, manufactured, distributed, sold and maintained by somebody.  Are you going to try to tell us that the advent and rise of the PC a la Microsoft Windows™ cost people jobs?  If so, please regard yourself as an expert and stop speaking.

“Conthider theeth clueth”

A truly “thoughtful” paragraph.  May we reiterate; THERE IS NO SUCH THING AS A JOBLESS RECOVERY!!  You certainly can’t call it the norm.  I don’t know if our author just doesn’t know how to read a simple graph or was relying on “experts” who don’t know how to read a simple graph.

Here are the official stats from the Bureau of Labor Statistics (www.bls.gov)

Jobless recoveries are the norm?  Do the ’91 and ’01 recession/recovery cycles look jobless to you?  They don’t to us, either.  The only divergence we see is occurring right now and is in large part due to the fact that most cyclical recessionary periods last eighteen to twenty-four months.  We are moving deeper into uncharted territory every day with no indication of policy change on the horizon.  That will perpetuate the pain.

When will these guys understand that companies do not hire to be nice and fire to be mean?  Good executives manage the size of the workforce based on demand.  Managers who don’t have companies that go out of business.  Managers of yesterday did not keep “unneeded” workers.  A lack of technology required they keep a higher percentage of people.  Even then, as now, however, necessity is the mother of invention.  A firm’s first priority is to survive.  Remaining employees become committed to keeping their jobs by enhancing the survival prospects of the company.  They innovate, experiment and execute on new ideas that increase efficiency during and beyond the recession.  Does that mean certain “jobs” won’t be recalled.  Yes.  But if the company is more efficient in the face of rising demand new positions will automatically be created which, of course, leads to growth which leads to new hires with different job descriptions.  As to why layoffs were faster this time; data analysis continues to accelerate in speed, sophistication and accuracy.  The downturn started as then-Senator Obama became the clear frontrunner in 2007.  The policy priorities of his administration were obvious to those who invest real money and hire real workers before the election.  In other words, businesses could see it coming sooner than in the past and reacted appropriately.

“Experts” Groshen and Potter tell us when layoffs are permanent recovery is slower.  They get paid to elucidate these nuggets of truth.  No kidding!  But the idea that it’s because it takes time to review resumes is silly.  They talk of the evils of part-time and temps?  When things improve for real who do they think are the first candidates for conversion to full-time employment?  Could it be the temps already trained and experienced?  Resumes are the bottleneck to recover? C’mon!

Yes, responsible executives care about stock price.  They have to answer to the owners of the company, public or private.  Why the authors paint this as a negative is beyond me.  An even bigger mystery is how he can suggest that flexibility and stability are competing priorities.  A company that can’t be flexible can’t achieve stability.  Stability is never a guaranteed constant without a commitment to flexibility.  Flexibility is the currency that buys stability.  Just ask Borders and Blockbuster.  They continued to operate with 1980’s and 1990’s business models.  Their lack of flexibility lead to fatal instability.

We could go on for pages about the apparent confusion as to why a company may choose to hire overseas but we think our readers get it.  We do, however, have to comment on the idea that China’s increasing wages of up to 17% of U.S. wages by 2015 will spark a mass exodus back to the U.S.  We may start to see some movement in that direction but only an “expert” or one who relies on “experts” could think that a delta of 83% is insignificant when making payroll.

As to the yadda yadda on difficulty hiring adequate workers, does anyone believe the sentiment “ya just can’t find good help these days” is new?

At the end of the day small business is the true driver of jobs in the U.S.  That’s why the notion of “too big to fail” is a travesty.  Had those companies been allowed to meet their appropriate fate it would have created untold new opportunity for talented people to start over and do it better than before in businesses of every size.  As it is policy has created uncertainty, fear, terrible unemployment and a solid hesitation to start new businesses or invest in the growth of existing ones and there is no end in sight.

We don’t know how else to say it, folks.  Policy matters.

Thanks for reading and…stay tuned.

© Blue World Asset Managers August 2011


Non-partisan, Experience Driven, Response to an Article by a Partisan Accusing Partisans of being Partisan

Tuesday, July 26, 2011

Ignorance is Curable. Stupid is Forever©

Non-partisan, Experience Driven, Response to an Article by a Partisan Accusing Partisans of being Partisan

Please read http://owl.li/5Nb6g

Our response follows:

Paragraph I:

The author suggests that uncertainty is a “bogus” reason for the failure of the economy to rebound.  That means uncertainty must be a “bogus” reason for businesses not to hire, right?  This “bogus” excuse, he says, is used by the right and business.  Does he believe that only those on the right can be business owners OR that left-leaning business owners are hiring at warp speed and the left side of the economy is booming?  Ya see, we analyze the economic reports each month and we can say with confidence he’s wrong, either way.

Paragraph II:

The uncertainty is certainly NOT political.  It is, however, based on another word starting with “p.”  The correct word is “practical.” 

Paragraphs III & IV

We’ll ignore the lunacy of the statement regarding “appropriate regulators” and move on to the really mentally challenged comparison of implementing current legislation to administering tax cuts and Medicare benefit additions.  The implementation of tax cuts is already understood in process and simple in form based on the IRS’ experience with increases, decreases, and even rebates.  Medicare is an existing bureaucracy whose main problem has always been the absolute knowledge of how to add benefits.  Using Dolt-Frankfurter (ok, Dodd-Frank) and healthcare reform as comparisons for implementation is similar to saying a pre-school child should be able to perform diagnostic and repair work on a semi because he’s played with a Tonka truck.  The former Speaker of the House said the four thousand page health reform legislation had to be passed in order to find out what was in it. http://owl.li/5Nd4K (video) The Representatives and Senators who voted for it admitted not reading it.  Senator Baucus said (with a chuckle, no less) even if Senators read the bill he could not certify they could understand it! http://owl.li/5Nep8 (video)  Dodd-Frank is twenty-seven hundred pages plus in its own right.  A year after passage the regulators, not the right and business, are the most frustrated with it because no one, including the authors, understands it well enough to write the new rules or even have a blueprint for implementation.  There is, certainly, no experiential template. http://owl.li/5Ndls    A year later as the first changes were to take effect it is estimated that eighty to ninety percent of the rules are still unwritten, stretching the responsible agencies beyond their limits. http://owl.li/5Nf1O   Many deadlines have been postponed indefinitely in spite of President O’s obvious affection for imposing unmanageable shot clocks.  How long did it take to receive your Bush tax rebates or for Medicare to start paying for your prescriptions once passed? 

Now, do we really need to talk about the absurdity that business owners and people experienced in the investment of real money and the hiring of real people should not have the right to challenge the regulations set forth by pencil pushing bureaucrats who’ve never risked a dime or signed a paycheck and, by the way, were the real authors of the financial crisis to begin with?  << Read why at http://ow.ly/4M2Ac >>  Does the author really believe that legislation should just be accepted without challenge or question to avoid uncertainty?  Doubtful.  We’re reasonably confident he doesn’t see litigation against things like the Arizona immigration law, Defense of Marriage, Welfare reform, entitlement reform or tort reform fostering unnecessary uncertainty.  Lawsuits to challenge the legislation are the source of uncertainty?  PLEASE! 

Paragraphs V & VI

The differences between the parties ALMOST guarantees a shift in policy?  For the first time in our history a major piece of legislation was passed against the will of those our representatives were elected to represent.  That is policy change we can do without.  I know the arrogance of the party responsible.  They think they know what’s fair and they think they know what’s best.  They have forgotten we don’t care what they think.  They are supposed to respond to what WE think.  They have forgotten that they are our employees, not our rulers. 

Our author demonstrates he completely misses the point.  Anticipation of rising taxes throws a wet blanket on the mood of business and individuals and the expectation they are coming down encourages  investment and increased business activity.  How do we know?  Simple.  We own our own business and are in the business of working with businesses, business owners and leaders every day and have been since the Carter years. There is no longer any uncertainty when it comes to Obama and the current administration.  They are now a known quantity.  They are committed, ideologically and legislatively, to an anti-business, pro-government, pro-wealth redistribution philosophy.  That’s fine.  Many of us knew this before the election and many more have learned it since.  The administration’s problem is that they are in the minority. 

 Americans don’t want a socialist society and we are not confused by the ideological differences between the parties.  It’s just that every once in a while an administration like this one comes along and reminds us that policy is driven by ideology and policy matters.  The people who actually put capital at risk, employ workers and create opportunity are very certain they have no friends in this administration.  The uncertainty resides in the sweeping rule changes already passed but without clear lines within which to operate, the contemplated regulation throughout the agency alphabet soup, and the rhetoric regarding future restrictive and punitive policy.  What we are certain about is the intent of the administration.  The only uncertainty, which is more than enough to keep the economy in neutral, is how bad will it get.  Don’t oppose his re-election?  The prospect of four more years?  Now that is a terrifying uncertainty!

Some Inconvenient Truths can be Backed Up by Real Math and Science-Part 2

Thursday, June 09, 2011

Brain surgery is not rocket science to a brain surgeon.©

Some Inconvenient Truths can be Backed Up by Real Math and Science

The Reality about Speculators, Commodity Prices, Fiscal Policy and Inflation

 Part 2: Why Speculators are Not Responsible for Inflation

Jimmy Buffett sang “don’t try to describe a Kiss concert if you’ve never seen it.”  This is great advice, especially when talking with someone who has!  To describe that which we have never seen to someone who has seen it causes us to appear ignorant at best and dishonest at worst (stupid is in the middle) because our audience can usually tell we have no idea what we are talking about.

Part 1 talked about what is really causing inflation.  In Part 2 let’s explore what isn’t.

Lately we hear a lot of politicians and talking heads of all sorts blaming speculators for soaring prices, especially fuel.  Most of these people have never seen a Kiss concert.  Are they ignorant, stupid or dishonest?  I suspect we cover the spectrum.  The scary thing is that many of these individuals have the power to regulate activities IN WHICH THEY HAVE NO EXPERIENCE.  Ultimately, I don’t care who is incompetent or dishonest.  Either way the net conclusion is the same.  They should not be in charge of anything.  Here is all the information you need to understand why “blame the speculators” is, in a word, wrong.  It is worth keeping in mind that several in the current administration have, at one time or another, articulated a desire for $5.00 per gallon gas.  These economic concepts are very basic so if you’re wondering about ignorant, stupid, dishonest…

Perception, Reality and Reaction:

In the interest of full disclosure, what we said earlier is not entirely accurate regarding supply and demand causing price changes.  We do not operate on reality.  We operate on the perception of reality.  An announced increase in crude production by OPEC will not change the supply of gasoline by morning but it will sure as heck move the price.  That is because investors are reacting to a perceived future increase in the supply of crude that may or may not ever materialize.  Again, it is a reaction to a perception of future reality.  This is an important point in understanding commodity (futures) markets.


Commodities Markets:

Even though there are only around a hundred traded commodities, the futures markets account for more dollar volume than all the stocks and mutual funds combined.  That is quite impressive when you consider the tens-of-thousands of stocks and funds out there.

A commodity is a raw material like corn, silver, cattle, hogs, crude oil, cotton, etc.  These commodities are traded based on criteria including standardized quantity, quality, delivery date and, of course, price.  The deals or trades are made based on a contract between two parties, buyer and seller, which specifies the above, and any other, standard parameters associated with the commodity. 

There are two general participants in the commodities markets:

Hedgers: 2 types

                   i.      Producers: these are the producers of raw materials from grains to cattle to gold so they are the loggers, farmers, ranchers, miners, etc.

                   ii.      End Users: These are the folks that turn the raw material into finished products so a baked goods factory buys wheat from a farmer and makes bread

Speculators:

Speculators have nothing to do with the actual commodity.  They do not grow it, dig it up or raise it.  Their only relationship to the product is the contract specifying what the commodity is.  Their only goal is to make money on a change in price, up or down. 

By the way, contrary to what you may have heard in commodity legend if a speculator misses a date he does not get 300 bushels of corn dumped on his lawn.  He usually gets a warehouse receipt telling him where his corn is being housed and what it will cost to keep it there.

So, how does each of the above players fit into the picture?

Hedgers:

The hedgers do not use commodity contracts to profit from price swings.  They use them to protect themselves from price swings, hence the term.  For example, a farmer is nearing the harvest around the middle of August and corn is trading for $5.00 per bushel. He deems that a satisfactory price based on his costs that year.  Based on a number of factors including weather, supply, demand, etc. he knows there is no guarantee that the price won’t change between now and the end of harvest in November.  An end user may see corn at $5.00 and feel that would be a safe price for a raw material based on his costs and pricing that year.  What they may do is enter into a buy/sell contract for $5.00 per bushel to occur in December.  Both parties benefit because the farmer knows in advance what he will get for his corn, allowing him to budget appropriately, and the end user has fixed what could otherwise be a variable cost allowing him to budget appropriately.  The risk they both share is, of course, that the price could change; go up before December, costing the farmer money or down costing the end user money.  In either case both have agreed on a price acceptable to each and they are protected (hedged) against adverse price swings.


Speculators:

The life’s blood of any publically traded market is liquidity.  Liquidity means that there is enough interest in something that it can be converted to cash very quickly.  For example, at any given time there may be three or four people that think our house is perfect for them.  In order to find them we usually need to list the house with a broker so that many people can see the house in an effort to sift the three or four would-be buyers.  The time from agreement to closing  may be weeks to months.  Our house does not trade in a liquid market.  We cannot put our house up for sale and expect to convert it to cash within seconds.  Compare that with the speed of selling stock on the stock market.  Blink, and we’ll miss the conversion of stock to cash.  The ideal situation for any home seller is to have more than one buyer interested.  Why?  Because they will compete with each other to make the best offer.


The commodities markets are very liquid.  Why?  Because in addition to the hedgers we have speculators adding to the interest in commodity prices and trading volume.   What would happen to prices if the only players were producers and end users?  The producers could demand, and the end users could afford much higher prices because there would far less competition over price.  Producers would set pricing and end users would pass a disproportionate product cost increase onto the consumer. 


Ahhh, I think we are starting to see the true role of the speculator!  They provide additional liquidity to the markets.  Speculators enhance the competition for price that keeps costs in line.  The sellers compete to have the lowest price to sell, even by a penny, to be first in line for the next contract and the buyers will compete to offer the highest price to buy, even by a penny, to be first in line for the next contract.  I hope you can appreciate how this competition (buyers vs. buyers and sellers vs. sellers) keeps the market liquid, efficient and as tight as possible.  Speculation is an exercise in reaction to perception and prediction.    We must realize, this is a zero-sum proposition.  That means there is a winner and a loser in every speculation contract.  A buyer of a contract thinks prices will rise.  The seller of a contract thinks prices will fall.  One of them is right, and one of them is wrong.  One will make money, and one will lose money.  That’s it.  News of a peace accord in the Middle-East will foster a perception of increasing future supplies of crude.  An early frost in the heartland will fuel a perception that the corn harvest will be adversely affected.  A strengthening of the dollar will decrease the perceived future demand for gold.  What we must take away from this is: Speculators REACT to perceived future conditions of supply and demand.  They do not create them!

Hedgers and speculators combine to increase trading competition making them the consumers’ guardian angels, not their nemeses.  Is the system perfect?  No.  None is.  Sometimes things heat up irrationally but those situations are short lived.  Sometimes people endeavor and/or collude to profit unethically or illegally.   Not only are they in the vast minority, these morons always get caught eventually because the sheer volume of legitimate trading activity exposes anomalies. 

It is always the thief that steals then deflects blame to someone else.  Blue World manages farmland.  We trade derivatives and we speculate on commodity prices.  Credentials matter when educating, opining or making policy.  So, the next time someone offers to describe a Kiss concert, demand they produce a ticket stub.


We always appreciate your time and consideration…stay tuned!

© Thursday, June 09, 2011Blue World Asset Managers