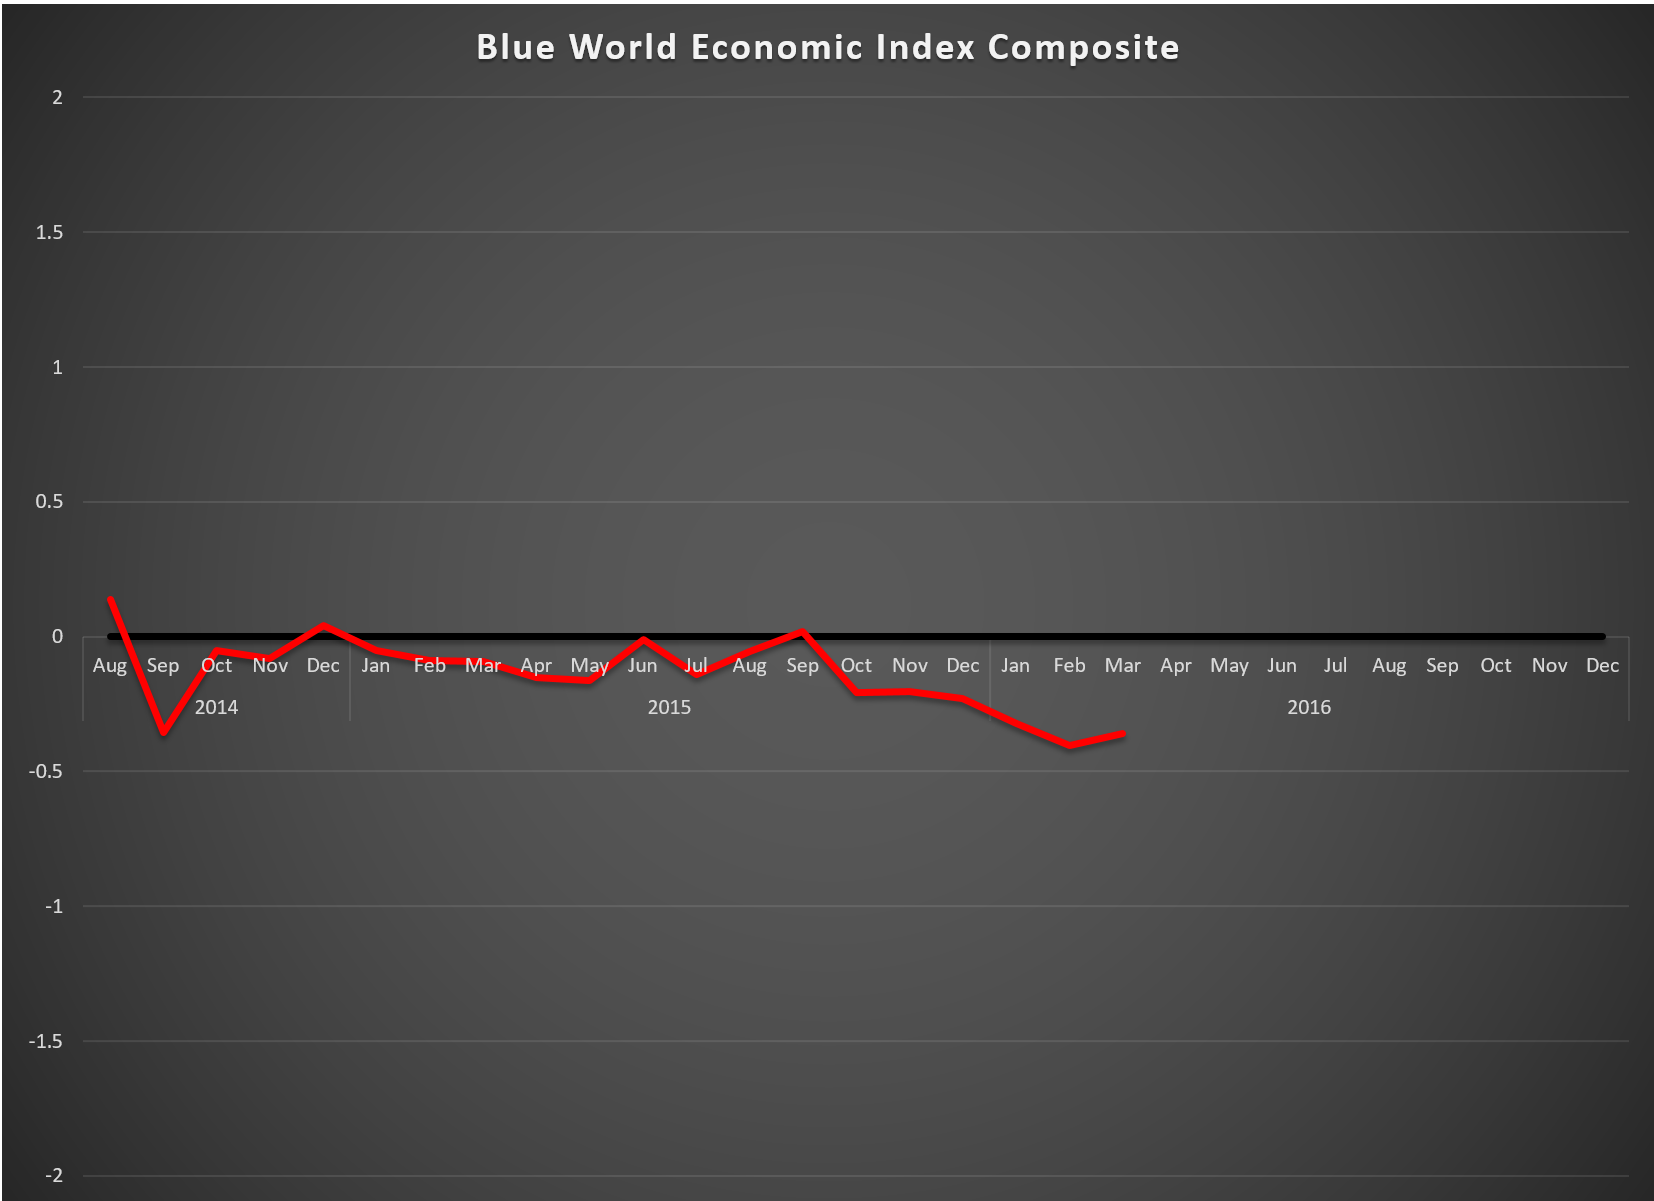
Blue World Economic Index®
Scale: -2 to +2
Release Date: Usually the Last or First Business Day of Each Month
Release Site: www.blueworldassetmanagers.com
Management Value: Critical
Release Site: www.blueworldassetmanagers.com
Friday, April 29, 2016
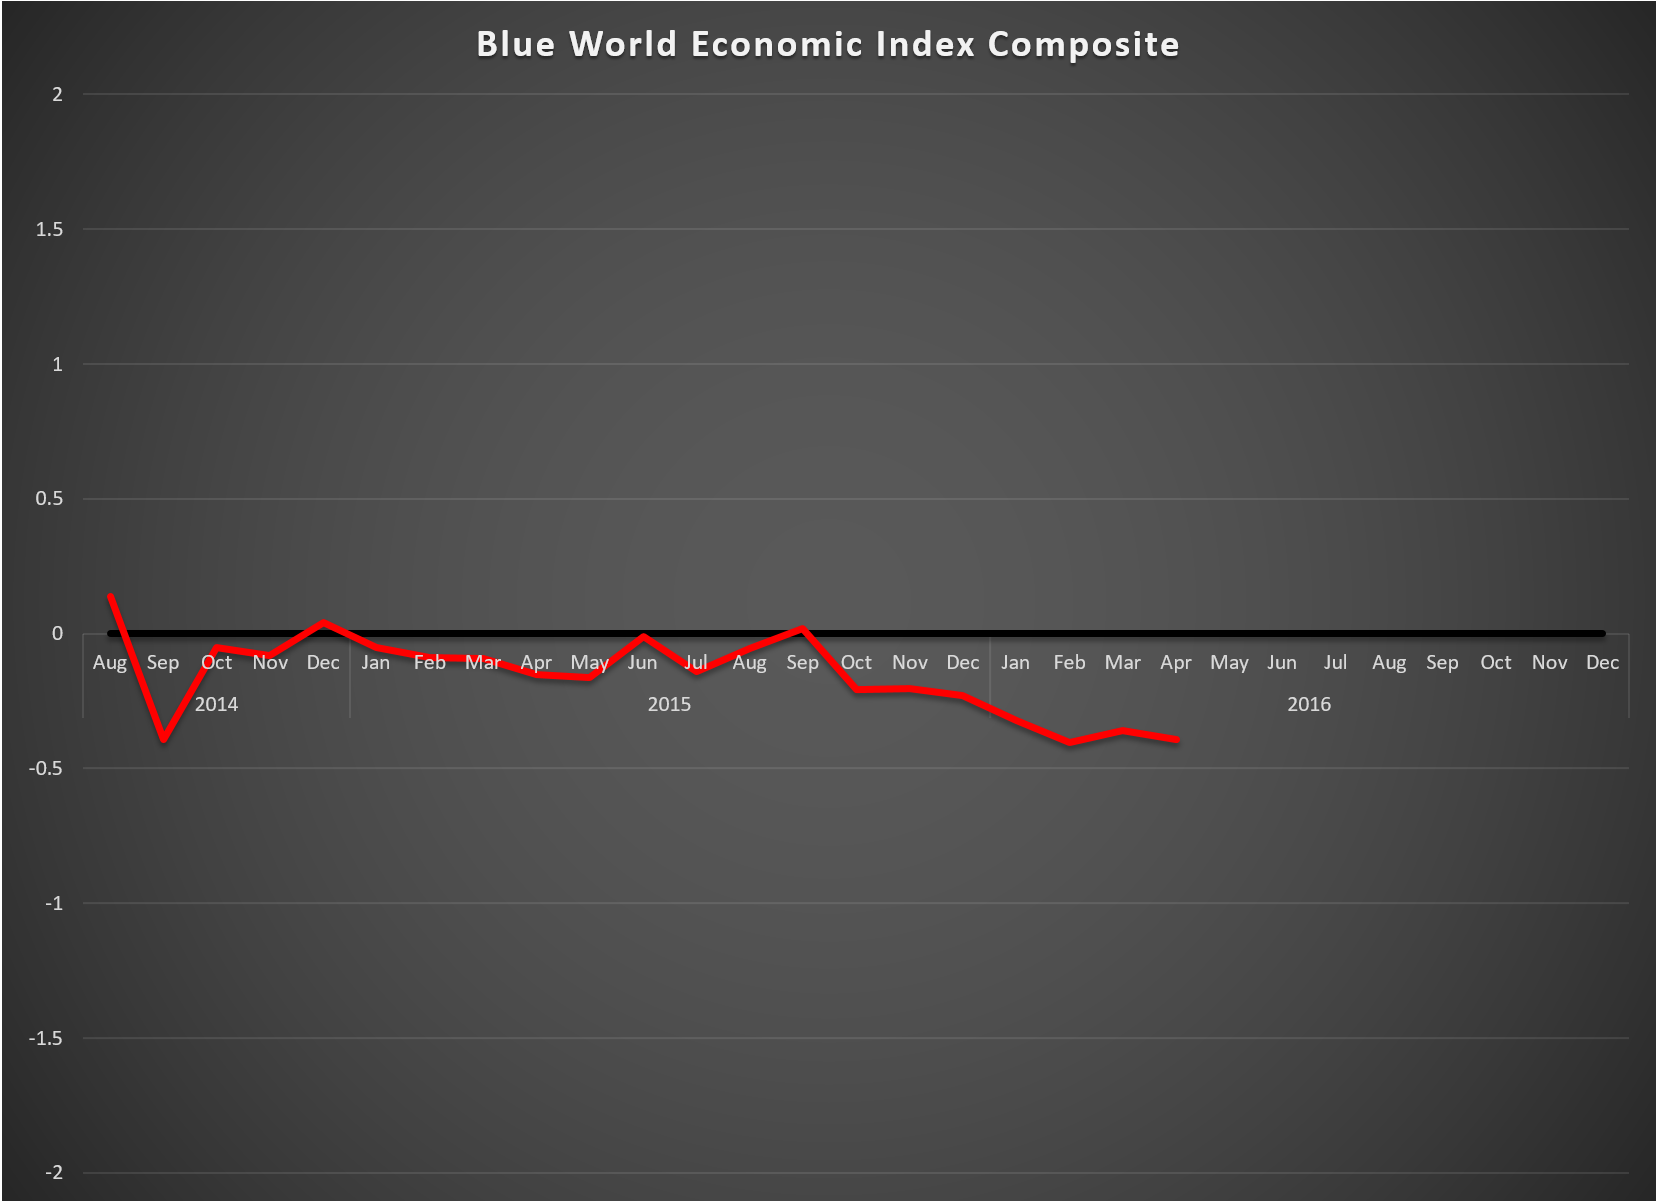
April started out with a little optimism as reporting from March hinted at some possible momentum, then the Empire State Manufacturing Survey kicked off the Fed district reporting at mid-month with solid positives, but it all went South in a hurry.
The BWEI® tied its lowest reading of -.39 since we started making the index available publicly in August of 2014.
Of the 8 major categories, 3 managed readings above 0 including Consumer Measures, which slipped a substantial .5 from .8 to .3. Real Estate and Services join Consumer on the plus side of zero, and both showed fractional improvements over March. Employment, General Measures, Inflation, Manufacturing and Retail remain in decidedly negative terrain.
We don’t see the Fed making any big moves based on this data, which should make the markets happy but signal defense to those who manage real businesses and employ real people.
Look for The Blue World Jobs Report Analysis next Friday and have a great week.