Pixels vs. Images: A Quick Take on GDP, Markets, Business and the Economy

Wednesday, June 26, 2013

Ignorance is curable. Stupid is forever.©


Pixels vs. Images: A Quick Take on GDP, Markets, Business and the Economy

So, China growth slows and the U.S. markets tank.  U.S. growth slows and the U.S. markets fly?  That’s what happened this month.  We even saw a market “expert’s” headline today “GDP Revised Down but Street Still Optimistic on Economy.”  “Based on what” is the question we’d ask.  Again, every headline today indicates the drop in GDP was “unexpected.”  This continues to be our problem with the “experts.”  They read one day’s news and proclaim a definitive view on the economy.  The next day some new data is released and we get a whole new view, as if yesterday’s news was totally negated or, even worse, totally forgotten.

For market investors that’s fine AS LONG AS they know how to play defense. We, obviously, don’t object to a rising market whatever the reason.  We just worry about the folks who are naked.  As we’ve said, it makes us nervous when there are no fundamentals to support a bull market.  We are happy to make money on it but we are ready for reality shocks, too.  As long as you’ve got your swinging accounts, stops, puts, inverse ETFs, long-short strategies, or whatever other defense you/your advisor employs then let the market run and run with it.  We do.

Running a business is a different story.  As managers we have to be more concerned with economic fundamentals because we don’t have the kind of defensive measures that are available in the markets. The only defense we have is a keen awareness of what the economy is actually doing so that we can make appropriate decisions on everything from hours of operation to inventory stocks to employment.

The deplorable GDP is NOT a surprise if we’ve watched AND REMEMBERED all the other reports from this and previous periods.  No report is valuable unto itself.  Each must be viewed through the prism of the universe of data sets. Then each new data set must be triangulated with and compared to the rest of that universe.  It’s the difference between viewing a single pixel vs. the entire image.  Each data point that is released is just a single pixel in the image that is created when all the pixels are viewed together.

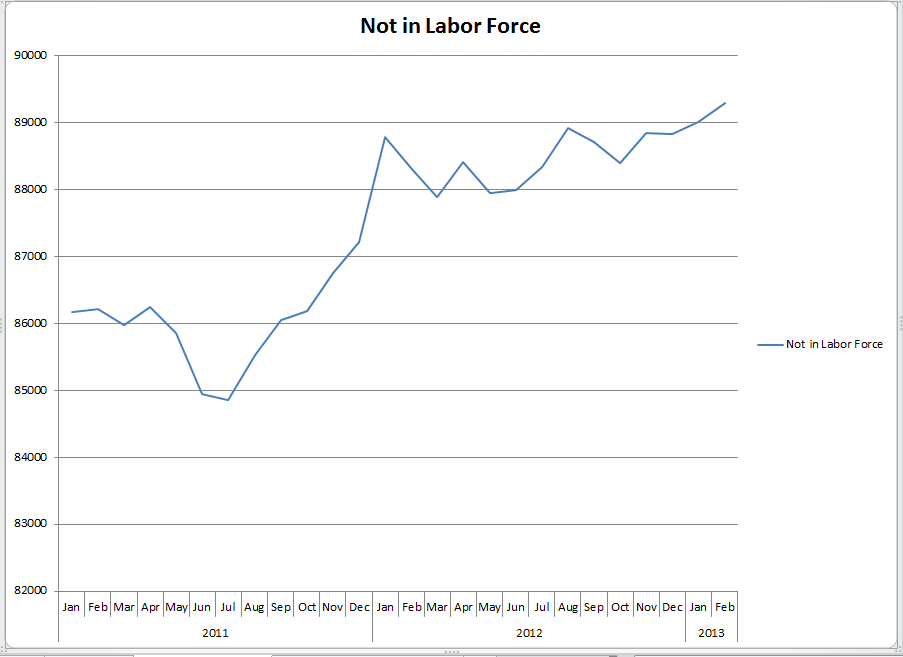
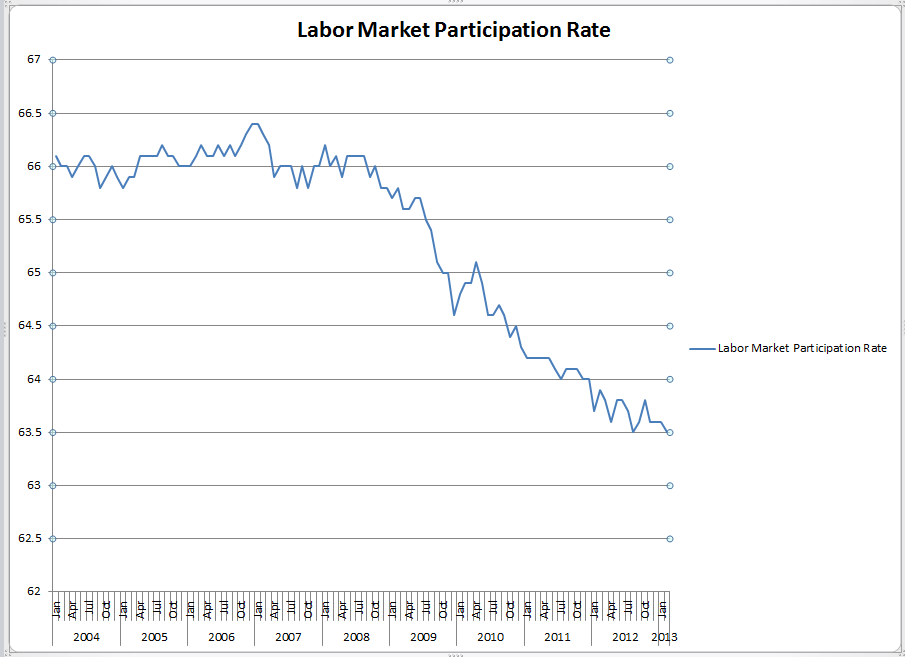
That’s how Blue World does it.  For example, starting with the two most recent employment reports (Blue World Analysis at & ) we saw a continuing trend of flat hours, overtime hours and wage growth in manufacturing.  The diffusion index (number of companies hiring) fell below fifty percent and the labor force remains stagnant.  Then, all the regional Fed reports ranged from negative elements to negative across the board in each of the last two months.  Sure, we hear some of you yelling at us about the positive Durable Goods report this month but, again, viewed historically the reports has been very volatile. “Good” is nowhere near what “good” should/used to be and the current year over year level is no better than February of 2012 and far worse than it was in 2010!  See Econoday’s chart at .

The markets do not reflect reality.  Please don’t use them as a gauge to make decisions in your sector, business or department.  Just ride them as they produce and let us know if you’d like help with the defense.

There is tremendous uncertainty regarding the effect of tax policy, ObamaCare, immigration reform and a multitude of other domestic and international issues.  Follow Blue World for a big-picture take on the economy and to aid in business decisions.  Call us for individual help and analysis.

Our assessment continues to be that the economy is not in a meaningful recovery.  We have an extensive collection of pixels that we organize into an image to back up that assessment.  That’s why we typically only use the word “unexpected” when we read an “expert” who got it right.

As always, thanks for taking the time and stay tuned…


Every effort is made to ensure accuracy of data transcription but accuracy cannot be guaranteed.  Referenced sources should be reviewed.  Any analysis represents the opinion of Blue World Asset Managers, Ltd. who does not warrant or guarantee predictions based on its analysis.

©Blue World Asset Managers, LTD Wednesday, June 26, 2013

Counterfeiting is a Very Serious Crime…Unless the Fed Does It??

Thursday, June 20, 2013

Ignorance is curable. Stupid is forever.©

We have been ringing the alarm bell about this in our posts and Matt has spoken of it on the radio.  We are getting more and more questions about it as the likelihood of slowing the current bond buying program (Q.E. whatever) looms.

Ask anyone, including market “experts” if it’s a good idea or bad idea for the government to “kick the can down the road” and they’ll say it’s a bad idea.  Then ask if they want the Fed to slow the bond buying program and they’ll exclaim “NO” in a panicked voice!  What this betrays is a complete lack of understanding of what “Quantitative Easing” actually is.

First of all, it should be of great concern to anyone with money in the markets that government action, even contemplated government action, has become more important than economic fundamentals.  Think of how absurd it is for the markets to panic at the thought of improving economic conditions that would lead to LESS government interference.  Ya get that?  THE MARKETS SELL OFF WHEN THE ECONOMY SHOWS SIGNS OF IMPROVING!!  That is absolutely terrifying.  When reality catches up, and it always will eventually, the results for those in the markets unprotected will be potentially catastrophic. 

So, what is “Quantitative Easing” in actual practice?  As with most things it is very simple.  The Fed is buying short term debt (bonds) that are nearing expiration and refinancing the debt for a longer term.  It is the very definition of “kicking the can down the road.”  That is deplorably dangerous economic policy as it is, but never discount the government’s ability to take a bad idea and make it worse.  WE DON’T HAVE THE CASH TO PAY OFF THESE LOANS!  They are printing money out of thin air to pay off the loans and borrow the money for a longer period!  If you did that you’d be arrested for counterfeiting!  Does that help explain why you are hearing all this talk about the U.S. dollar no longer being the world’s reserve currency?  By printing more supply of money without the demand for it we dilute the value of the currency and that’s why counterfeiting is illegal.  There are two blog posts we did last year that explain this in more detail including an explanation of inflation and commodity impacts.  They are:

Some Inconvenient Truths can be Backed Up by Real Math and Science Parts 1 and 2

They can be found at:

and

We hope this helps answer some of the questions surrounding the market’s behavior these days.  Call or e-mail us with any others!

Thanks for reading and please stay tuned…

Every effort is made to ensure accuracy of data transcription but accuracy cannot be guaranteed.  Referenced sources should be reviewed.  Any analysis represents the opinion of Blue World Asset Managers, Ltd. who does not warrant or guarantee predictions based on its analysis.

©Blue World Asset Managers, LTD Thursday, June 20, 2013

Blue World Employment Situation Report Analysis 5-3-2013

Blue World Employment Situation Report Analysis

Release Date:  Usually the first Friday of each month

Release Site: www.bls.gov

Market Sensitivity: VERY HIGH

Management Value: VERY HIGH

Friday, May 03, 2013

Brain surgery is not rocket science to a brain surgeon©

THE CAUTION FLAG IS STILL OUT!

165,000 net jobs created with an upward revision of last month’s abysmal 88,000 to 138,000 has caused a media/market “yippee.”  Allow us to remind those who invest real money and employ real people that this remains consistently about 100,000 jobs per month short of break even with the participation rate reaming at record lows as the civilian labor force fails to grow.

The copy/paste function is getting worn out regarding the continued observation that “reductions” in the unemployment rate are due to a simple mathematical truth instead of any actual improvement in the labor market.  Yes, April 2013 demonstrates that the increase in jobs outpaced the growth in labor force size.  That moves the two tops closer together and we have the artificial “improvement” in the rate.  The current graph…

 Labor Force vs. Employed


The rest of the story could be titled “The Next Installment of BLS’s Chamber of Horrors.”

We haven’t seen a “good” labor report in years, now.  Some have been worse than others but as we have shown, the pattern of this “recovery” does not match that of any other economic recovery period going back to the 1970’s.Please see our post “A Flute With No Holes Is Not A Flute and a Recovery With No Jobs Is Not A Recovery”

Many argue that the employment numbers are historical in value and some say they have predictive relevance.  The truth is that both statements are accurate.  There are hundreds of lines of data in the full release spread across more than two dozen tables.  We read the data so you don’t have to!  There are some very scary trends developing in the foreshadowing portions of this report.

The 25+ with a Bachelor’s degree, or better crowd rose back to 3.9% which continues to be historically record-setting but appears to have become the new “norm.”  Additionally, however, we have now seen the rate moving back up toward four percent coupled with a REDUCTION of average weekly pay!  That’s not good.

The work week for all employees hit a three month low in April 2013 and is lower than April of 2012, all of which is bad enough considering where we are in the cycle but more concerning is the thee month down trend in work week length in construction and manufacturing with corresponding reductions in weekly earnings in those sectors.  If you follow us on Twitter, Linked In or FB this comes as no surprise as we’ve shared some detail from the regional Fed. Manufacturing reports this month.  All have been negative and validated by this morning’s diffusion rate across the 81 manufacturing industries falling to 44.4, the latest data point in a steep, three month downward trend. (The diffusion index indicates the number of companies adding as opposed to losing jobs where 50 is break even, below is contraction and above is expansion.)

Those working part time for economic reasons, especially slack work conditions, took a big jump and there were significant increases in those unemployed between 1 and 26 weeks.  Those unemployed less than 5 weeks are new job losses.

The report is bad.  The market is flying.  We are in it and riding the wave but we keep moving the safety net closer and closer on the chance that economic fundamentals once again become at least as important as government actions and headline spin.  Let us know if you’d like suggestions.

If you are a business manager/owner then pay close attention to your internal financials, industry dynamics and Blue World’s content via the social media outlets.

SEMINAR ANNOUNCEMENT

Based on popular demand we are sponsoring a seminar at the Union League Club in Chicago on Friday, June 6th.  Content centers on the core entrepreneurial skills required to truly manage a business toward success.  The title says it’s for health care professionals but it applies to any business so please realize anyone is welcome.  Course description and registration links follow:

Course Outline Link:
http://www.blueworldam.com/seminars/Skils-Heathcare-Provider.html

Registration Link:
https://blueworld.wufoo.com/forms/entrepreneur-skills-for-the-health-care-provider/

As we are about to publish we see factory orders have dropped over 30% more than “expected” by the “experts.”  Surprised?  Not if you’re following Blue World!!

Thanks for reading and, please, stay tuned…

Release Site: www.bls.gov

Every effort is made to ensure accuracy of data transcription but accuracy cannot be guaranteed.  The official release site should be cross referenced.  The analysis represents the opinion of Blue World Asset Managers, Ltd. who does not warrant or guarantee predictions based on its analysis.

©Blue World Asset Managers, LTD Friday, May 03, 2013

Blue World Employment Situation Analysis 3-8-2013

Blue World Employment Situation Report Analysis

Release Date:  Usually the first Friday of each month

Release Site: www.bls.gov

Market Sensitivity: VERY HIGH

Management Value: VERY HIGH

Friday, March 08, 2013

Brain surgery is not rocket science to a brain surgeon©

Not bad.  Not great, but not as bad as what we’ve become accustomed to.  There are those who will offer politically motivated assessments of this report, and both sides will have ammunition, but no matter who you are, a number like 236 thousand is nothing to poo poo when we haven’t seen anything north of 200k in quite some time.

Big gains were tallied in the goods producing sector with construction leading the way.  In the private services sector, information services, retail, business services, temp jobs and, of course, health care added meaningful totals.

While the overall length of the work week remains uninspiring, there was a notable improvement in manufacturing (durable goods) which jumped from 41 to 41.3 hours.  In and of itself 41.3 is nothing to write home about, but it does represent a breakout from the recent term pattern.

Wages were also up by respectable amounts in certain areas including weekly construction and manufacturing pay.

The downside…Let’s start here.  7.7% unemployment in the United States of America is simply unacceptable no matter what the current size of the labor force.  Yes, the rate is down again this month but that’s because, you guessed it, new hires went up and the labor force got smaller.

Here are the latest charts.

Labor Force vs. Total Employed

Labor Force vs. Total Employed

Not in Labor Force

Not in Labor Force

Labor Force Participation Rate

Labor Force Participation Rate

It’s difficult to get too excited about the number of new jobs, even at +200k, and the unemployment rate when we continue to see contractions in the size of the labor force and participation rates.  If the labor force were the same size now as it was back in ’08-’09  the unemployment rate would be well above 10%.  As we’ve said, we can’t improve the labor market by reducing the number of workers in it.

So, all in all, we would consider this a mixed report.  That is a HUGE improvement over what we’ve had to work with for a time period no longer measured in months or even quarters but years!  PLEASE remember, no report is meaningful unto itself.  The upside in this report only matters if it becomes the beginning of a sustainable trend of improvement.  You know we’ve seen this head fake before, so don’t run right out and open the purse strings into a strong tail wind just yet.

BTW: Last month we pointed toward the income and outlays figures as something to watch.  The reports were as expected, down.  Even with the income improvements seen here the tax bite appears to be overwhelming the increases.  Overall this month the total complexion of the economy remains unchanged at mixed, with about as many negative reports as positive and today’s jobs report being one of the brighter spots for a change.  Key reports to watch this month will be income and outlays, GDP and productivity, which took a bit hit in February.

Well, it wouldn’t be a Blue World analysis if we didn’t mention the market.  Doesn’t its behavior just kill ya?  All these lackluster jobs reports headlines with deplorable detail and the market just flies.  Today the headlines are a little better, and there are actually some bright spots in the detail yet the market opens ho hum, and as of 9:00a Central time has turned decidedly downward.  Go figure.

As always, thanks for reading and please stay tuned…

Release Site: www.bls.gov

Every effort is made to ensure accuracy of data transcription but accuracy cannot be guaranteed.  The official release site should be cross referenced.  The analysis represents the opinion of Blue World Asset Managers, Ltd. who does not warrant or guarantee predictions based on its analysis.

©Blue World Asset Managers, LTD Friday, March 08, 2013

Blue World Employment Situation Report Analysis 02-01-2013

Blue World Employment Situation Report Analysis

Release Date:  Usually the first Friday of each month

Release Site: www.bls.gov

Market Sensitivity: VERY HIGH

Management Value: VERY HIGH

Friday, February 01, 2013

Brain surgery is not rocket science to a brain surgeon©

The operative word today is…spin.  When we saw the jobs numbers at first pass we thought “wow, this is ugly.”  Now we go and read the BLS summary and some stuff around other notable publications and are quite amused by the characterizations of the report.  For example, do you notice how when the rate falls by a tenth that is an “improvement,” but when it ticks up a tenth it is “essentially unchanged?”  The Journal’s analysis wants to focus on upward revisions to last year’s estimates from an average of 153k per month to 181k per month.  That means instead of being 100k short of breakeven per month we’re only 70k short of breakeven per month?  Say nothing of the fact that 2012 is over!  Are we going to make different business and investment decisions based on an estimated “improvement” from last year?  It’s utterly ludicrous!

This is why you read us, folks.  No spin, just an objective analysis of the data (with occasional commentary on how policy affects the data.)  Remember, the data is not “good” or “bad.”  It’s just data that requires the people who invest real money and employ real people to make sound decisions based on the objective analysis of the data.  So, analysis can be “good” or “bad” and decisions can be “good” or “bad” but the data is just data.

Some quick numbers, then…  The rate ticked up to 7.9%, but so what?  We’ve shown how the unemployment rate is a poor indicator of labor market health these days based on the ratio of the labor force size and the total number employed.  This month is no exception.  That observation is validated by the facts that the participation rate is unchanged for three months during an overall downward trend during 2012 (as long as we’re focusing on 2012), the total number of people not in the labor force increased, and the total number of people reporting as in the labor force but unemployed rose again!

The work week for all employees is unchanged and short for three months, but construction AND manufacturing showed  a reduction in the length of the work week for all employees as well as production and non-supervisory employees.  That hasn’t happened in a while.  There were notable downward revisions to hourly and weekly wages in manufacturing, and the preliminary data for last month shows a decline over those downward revisions.

Is there more? Yeah, but I think we get it.

We analyze over one hundred reports per month.  Occasionally we do a post regarding other economic reports, but the employment report is the one we post our analysis of every month.  That’s because it gives the investor and business manager the most insight into the economy.  Why?  Because it tells us who’s not working and for how long; who is working and for how many hours per week in which industries; plus how much they’re making.  That eliminates most of the potential surprises in the other reports that come out.  For example, was the negative GDP report from earlier this week a surprise?  Not if you’ve followed us!

I’ll be on CBS radio Chicago (WBBM AM 780, 105.9 FM) to analyze next month’s jobs report and the economy in general on Friday, March 8th.  A couple of the reports we will be paying particular attention to during month are the consumer mood reports and the income and outlays reports.   The consumer mood indicators have already taken a beating and we expect those to remain weak.  We predicted that based on the realization that everybody’s paychecks got lighter, not just the $250k/yr + crowd.  Next month the effect of 2012 year-end bonuses and dividend income should be gone but the tax bite will still be there.  Add this to what we said about wages in manufacturing and we can see the potential for income and outlays to fall tracing the consumer mood values.  If that plays out we’ll start to see the effects reflect in the weekly data on retail sales, durable goods orders, etc.

The market is still rising, but remember how fickle it can be.  Let’s ride the wave as long and as well as we can, but make sure the defense is ready to deploy.  We advise business managers to be watching the economic reports and industry data as closely as their own internals with plans in place for various hypotheticals.  Call us if you’d like some help with that.

Have a great February.  Thanks for reading and, please, stay tuned…

Release Site: www.bls.gov

Every effort is made to ensure accuracy of data transcription but accuracy cannot be guaranteed.  The official release site should be cross referenced.  The analysis represents the opinion of Blue World Asset Managers, Ltd. who does not warrant or guarantee predictions based on its analysis.

©Blue World Asset Managers, LTD Friday, February 01, 2013