Blue World Jobs Report Analysis 2-6-2015

Blue World Employment Situation Report Analysis

Release Date:  Usually the first Friday of each month

Release Site: www.bls.gov

Market Sensitivity: VERY HIGH

Management Value: VERY HIGH

Friday, February 06, 2015

Brain surgery is not rocket science to a brain surgeon©

Capitol - 1


Hey fellas, Pay Attention!!

It just keeps getting weirder…

There were huge revisions to the upside for December and November 2014, yet the number of those unemployed for less than five to more than 27 weeks jumped.  The unemployment rate went up.  The participation rate remains below 63%, and the number of those unemployed rose…again.  Fuzzy math indeed.

That sums up a lot of the relevant numbers for January 2015, but also of note is that the headline number for this month was 257k new jobs.  In a reversal from the norm, the private sector number was better than that (267k) because government reports shedding 10k jobs for the month.  Hours and wages for the total private sector, construction and manufacturing remain uninspiring and that is consistent with data from all the other economic releases over the past month.  Of particular note are the Factory Orders and Productivity and Costs reports.  The number of those at work part-time for economic reasons is up, and sadly, there are 1.1M more citizens Not in the Labor Force than there were in January of 2014.

We follow over forty reports per month, note the data points as they’re published and follow the short and long term trends.  We put it all together for an overall profile of our economy and the profile is flat. How many times can we say it? (Rhetorical)  Policy matters and these don’t work.

Thanks for reading and, please, stay tuned…

Release Site: www.bls.gov


Every effort is made to ensure accuracy of data transcription but accuracy cannot be guaranteed.  The official release site should be cross referenced.  The analysis represents the opinion of Blue World Asset Managers, Ltd. who does not warrant or guarantee predictions based on its analysis.

©Blue World Asset Managers, LTD Friday, February 06, 2015

Key Labor Market Metrics 2011 – 2014

Here are the key metric graphs reflecting the annual data with revisions and including the full years of 2011 – 2014.  Revisions were minor and did not alter any of the poor short or long term trends reflected.

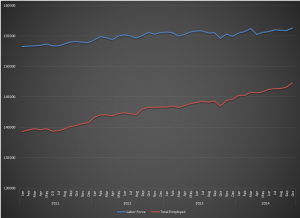
Starting at top, left we have the size of the labor charted against the total number of those employed.  We can see as the lines converge the unemployment rate calculation will become smaller even though there is no improvement in the labor force.  This point is validated moving to the right and then below, left showing the participation rate and the number of those no longer in the labor force.  The fact that the graph showing those no longer in the force is rising faster than the total employed line is very unsettling and not recovery-esque. Finally at below, right we see the length of the work week showing a very narrow average over the period.


Graphs - 2011-2015


Blue World Jobs Report Analysis 01-09-2015

Blue World Employment Situation Report Analysis

Release Date:  Usually the first Friday of each month

Release Site: www.bls.gov

Market Sensitivity: VERY HIGH

Management Value: VERY HIGH

Friday, January 09, 2015

Brain surgery is not rocket science to a brain surgeon©

Image: John Boehner


Do you hear us, AND ARE YOU LISTENING?!? 

Happy New Year everyone!  We hope the Christmas season was safe and joyous.  Now, back to business.  The jobs report is out and we’ll comment on it as usual but we will also offer a bit broader overview of how the economy fared in general for the period of 2011 – 2014.  We think you’ll find it rather sobering as we did.

First, the jobs report.  Same ‘ole theme of a decent number of new jobs with the private sector breakout sporting a little less luster than the headline number, which came in at 252k, 12k more than the private sector total.  The labor force shrank by another quarter million plus so, as has been the pattern, the number of those employed grew at a faster rate, further enhancing the irrelevance of the unemployment rate calculation.  The “Not in Labor Force” tally swelled by another half million driving the Participation Rate to equal its “recovery” record low.  There were corresponding spikes in the “Marginally Attached” and “Discouraged Workers” yielding a true unemployment rate just north of 11% which is, of course, also optimistic for the same reasons as the headline number.  Wages across the board, and notably in construction and manufacturing, took a noticeable hit with some downward revisions to previous periods.  The work-week length remained stagnant, BUT there may be a brightening spot.  The overtime hours in manufacturing has demonstrated small but nevertheless consistent increases for the 4th quarter.  Let’s hope that holds.

Annual revisions to the prior data will be showing up beginning next month so graphs may look a little hinky as they can at each New Year, but the patterns will be valid.  Here are some sobering statistics.

Percent Change for the period:

2013-2014 2011-2014
Labor Force 0.32% 1.45%
Total Employed 1.64% 4.38%
Participation Rate -0.61% -2.00%

This shows quite clearly why we say the unemployment rate as published has lost all credibility and value as a proxy for the health of the labor market and economy at large.

Speaking of the economy at large, well, it’s not declining, but it’s not advancing either.  Blue World tracks over 40 reports per month from both private and public sources in the following 8 categories:

General measures (i.e. GDP)

Consumer mood and activity

Employment

Inflation

Manufacturing

Residential Reals Estate

Retail Performance

Services Sector

Of those, in 2014 five categories were in mild positive territory as analyzed internally at Blue World, and three were slightly negative.  All told, this is still an economy waiting for a direction.  We have repeated the sentiment that policy matters, and it is no secret that we have been very critical of the ones in place.  We don’t care what works, just that it works…and these don’t.  We voters expressed a desire for policy change, and our new hires will take office this month.  Let’s pray they’re listening.

Thanks for reading and, please, stay tuned…

Release Site: www.bls.gov

Every effort is made to ensure accuracy of data transcription but accuracy cannot be guaranteed.  The official release site should be cross referenced.  The analysis represents the opinion of Blue World Asset Managers, Ltd. who does not warrant or guarantee predictions based on its analysis.

©Blue World Asset Managers, LTD Friday, January 09, 2015


Blue World Jobs Report Analysis 11-07-2014

Blue World Employment Situation Report Analysis

Release Date:  Usually the first Friday of each month

Release Site: www.bls.gov

Market Sensitivity: VERY HIGH

Management Value: EVEN HIGHER

Friday, November 07, 2014

Brain surgery is not rocket science to a brain surgeon©

What can we tell you?  Same ole’, same ‘ole…but we are not blind to the fact that that, in and of itself, it is a slight improvement even if for just one month.  We have had many reports over the last several years that were of the copy-and-paste sort, and then we’ve had those that fell well short of copy-and-paste by virtue of the detail exposing the truth about how bad it was in spite of the headline numbers.  That might cause copy-and-paste to become a bit of a relief.  But let’s be honest, this is not a “good” report, the labor market is not improving, and this is not a “recovery.”

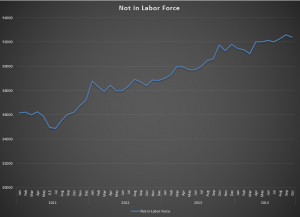
The headline says 214k new hires, but the number we care about, the private sector, only added 206k.  Last month we pointed out the Not in Labor Force number was growing faster than the number of new jobs created each month.  Some of our “expert” critics are already elbowing us (electronically) this morning about the 206k drop in that stat.  Ya know how we keep sayin’ trends and comparisons matter a lot more than data points?  Maybe we can teach those “experts” something here.  True, the number did drop by 206k, but in spite of that there are still 622k more than there were in October of 2013!!  We know our readers get it, but the experts need pictures so we’ll put in the graph later.  For now, here is some perspective.

  • The number of Employed Persons is 147,283M
  • The number of persons Not in the Labor Force is 92,378M
  • Since January of 2011 the Labor Force has grown by 2%
  • Since January of 2011 the number of Employed has grown by 6%
  • Since January of 2011 the number of persons Not in the Labor Force has grown by 7%

The 2% growth in the labor force vs. the 6% growth in employed people further illustrates why the unemployment rate, as published, is invalid as an economic metric, as well as both being pathetic for a three year period in the United States of America economy!.  The work week and manufacturing overtime remain flat, the participation rate is still languishing in record low territory, those unemployed with a Bachelor’s degree or higher ticked up, and meaningful wage growth remains absent.  Here’s that Not in the Labor Force graph with the labor force vs employed thrown in for good measure.

NILF for 11-7-14 PostFvE for 11-7-14

Maybe a cubicle-based “expert” can look at 92 million Americans (or whatever) out of work and see a “recovery,” but for those of us insophisticates who just own or manage businesses, invest real money, employ real people and make decisions that actually affect the economy, well, let’s just say “we don’t see a recovery.”

How many times can we say it; policy matters and these aren’t working.  Do we have some optimism that the election results from 11/04/2014 can lead to some more effective policies?  Yes, but remember, Washington is full of “EXPERTS!”


Thanks for reading and, please, stay tuned…

Release Site: www.bls.gov

Every effort is made to ensure accuracy of data transcription but accuracy cannot be guaranteed.  The official release site should be cross referenced.  The analysis represents the opinion of Blue World Asset Managers, Ltd. who does not warrant or guarantee predictions based on its analysis.

©Blue World Asset Managers, LTD Friday, November 07, 2014

Blue World Reviews EVIL DEAD – THE MUSICAL

Wednesday, October 08, 2014


Ignorance is curable. Stupid is forever.©


Blue World Asset Managers, ltd

reviews

 “Evil Dead – The Musical”


WOW, the “experts” are everywhere and never cease to amaze!  Our readers are used to us bashing them for their cluelessness when it comes to economics and market analysis, but apparently “experts” live in the entertainment critique sector as well.  We know that impressions of entertainment are completely subjective, and anyone is allowed to like or dislike anything they choose, but some of these “experts” blew our minds with their critiques of Evil Dead – The Musical!

Look through the reviews of this production and you’ll see the nose-in-the-air experts” enthusiastically pasting “not recommended” all over their critiques.  They offer a serious and technical review of the show – ya get that ?– a serious, technical review of evil dead – the musical.  How seriously must one take oneself to do that?  This is not Phantom, Les Miz, or Madame Butterfly.  IT’S EVIL DEAD – THE MUSICAL!

Let’s start here; is it lighthearted family entertainment?  No.  There is overt sexual humor and very coarse language.  If, however, you’ve taught your children right from wrong, what is acceptable vs. unacceptable behavior for them, and the difference between real blood and fake blood they’ll be fine, as was the adorable 10 year old girl sitting in the front row of the Splatter Zone for what was apparently her birthday.

After that, any hint of “serious” should stop.  This production was just plain fun as it was intended, “experts!”  We’ve certainly attended many productions that have thrilled the “experts” and walked out disappointed.  This show was an absolute blast!  We haven’t been that entertained in quite some time.  BTW, when I say “we” I refer to myself, my wife, and our 16 year old son.

The cast wonderfully overacted the stereotypical B horror movie roles, the voices were great, the dialogue and lyrics were hysterical and the cross-referencing of sequels and original cast were woven in beautifully.  Some humor was at an eighth grade, in your face level and some was very cerebral.  How could writers and actors be asked for more?

If any of the following are true, Blue World says “highly recommended”:

  • You like horror movies, especially the campy ones
  • You saw the Evil Dead movies, especially the original
  • You have a sense of humor
  • You realize your expelled digestive byproduct may yield an unpleasant osmic experience for those around you (That means you know your poop stinks, “experts”)

If none of the above are true you wrote “not recommended.”


Thanks for reading and…stay tuned!


Every effort is made to ensure accuracy of data transcription but accuracy cannot be guaranteed.  Referenced sources should be reviewed.  Any analysis represents the opinion of Blue World Asset Managers, Ltd. who does not warrant or guarantee predictions based on its analysis.

©Blue World Asset Managers, LTD Wednesday, October 08, 2014