Blue World Employment Situation Report Analysis – May 4, 2012

Blue World Employment Situation Report Analysis

Release Date:  Usually the first Friday of each month

Release Site: www.bls.gov

Market Sensitivity: VERY HIGH

Management Value: VERY HIGH 

Friday, May 04, 2012 

Brain surgery is not rocket science to a brain surgeon© 

Gotta love those “experts!”  There was a big miss, bigger than usual, on the new jobs estimates put forth by the economist community.  We should all be used to the surprises when the actual data comes out i.e. no longer a surprise.

If you’ve got a little time on your hands you can engage in one of our favorite amusements.  That is, watching the markets as the jobs report is released.  Pull up an intra-day futures chart and you’ll be able to spot the pre release jitters, the identification of the reduced unemployment rate, the realization that the number of new jobs forecast fell well below expectations and, finally, the beginning of the read of the detail.  Oh, what the heck…hold on and I’ll grab a chart.

The report is released at 7:30a CDT.  The chart starts at 7:28a CDT courtesy Ameritrade’s think-or-swim site.  The down trend continued through time of publishing at about 1:15p CDT.

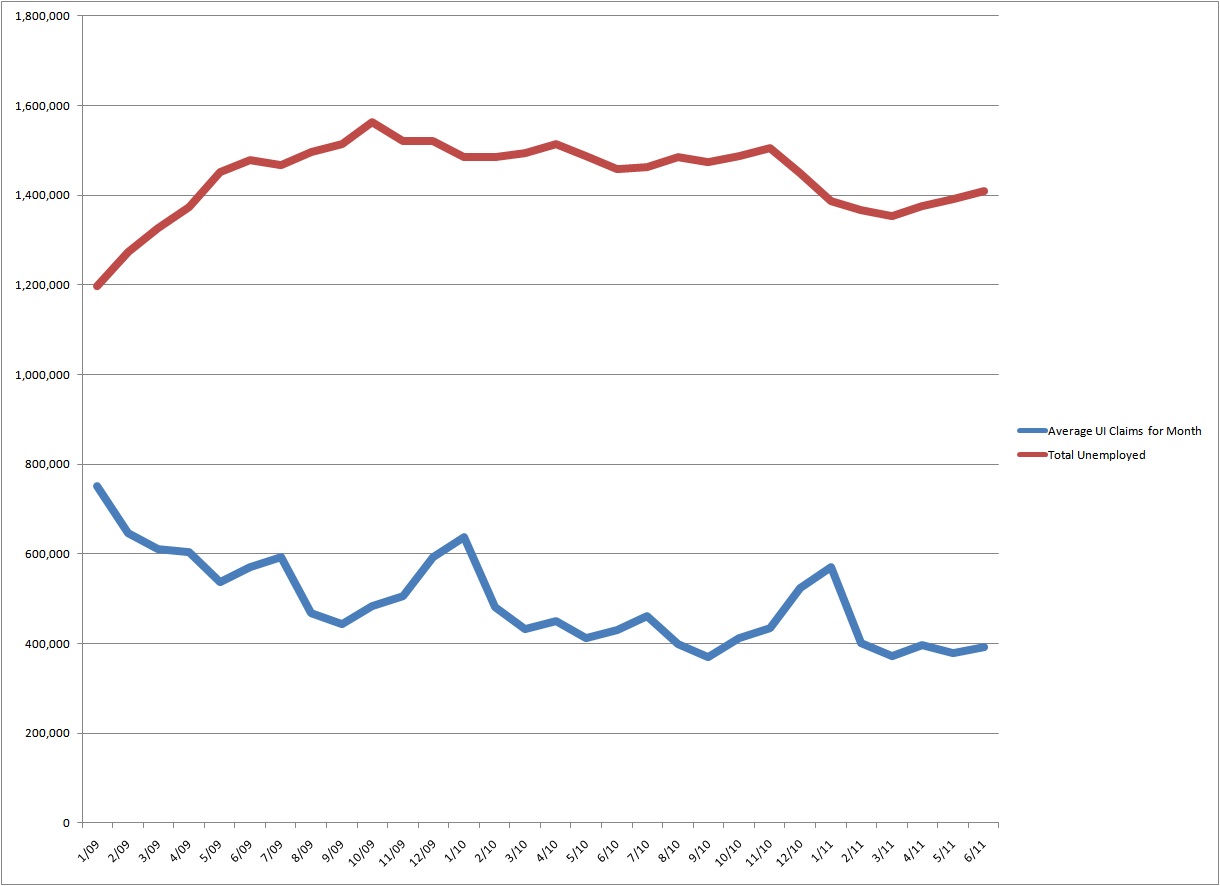
While the rate is down to 8.1% our quick review of articles out there proves that even the “experts” have caught on to simple math.  Heck, there is an article in the Journal entitled Why Did the Unemployment Rate Drop?  It actually does a good job explaining what we’ve been saying throughout this artificial decline in the unemployment rate.  If you’re new to our blog you can see a full explanation of this in our post Why Does Blue World Keep Saying the Labor Market is not Improving? at http://owl.li/aHzYx   The short explanation is that the number of employed people has been rising while the number of people reporting as members of the available labor force has been falling.  As we keep saying, you can’t improve the labor market by making it smaller.  This month there is an even more troubling trend developing.  The graph below based on data from www.bls.gov, will show that the number of employed people actually fell for the first time in many months.  Considering recent trends that should have kept the rate stable.  The trouble is that the labor force shrank by a larger magnitude than the drop in the number of employed people!  That’s a very disturbing trend we would not like to see continue.

Wage increases, plus changes in weekly hours and overtime are thoroughly underwhelming.  In fact, a deep dive into the data showed a backwards move in some of these key categories for production and non-supervisory workers in manufacturing and construction.  Even though inflation was down a couple of tenths, the earnings are still pathetically behind and that does not bode well for consumer spending.

There were notable up-ticks in areas where we don’t want to see up-ticks, such as the number of people at work part time for economic reasons, including slack work conditions and could only find part time work.  Marginally attached to the work force and discouraged workers were up.  That’s no surprise after seeing the overall labor force size decline on the first page.  A little-known statistic that we mention occasionally is Job Leavers.  These are workers who voluntarily leave their jobs before having another one lined up because they’re confident they can find other work when they want to.  While always quite volatile month to month, the decrease in their totals for April was dramatic enough to mention today.

In other data we continue to see productivity fall while unit labor costs rise.  Services declined in April, and that is disturbing at any time, but a spring decline is a departure from traditional norms as is the decrease in the labor force size.  If monthly data like this doesn’t provide one with a reliable sense of the quarterly GDP report then nothing will.  We continue to marvel at the shock expressed by so many authors and commentators at last week’s report.  A full explanation can be found at http://owl.li/aHGSG in our post The Confusion Suffered by “Experts” II – GDP April, 2012

Encourage your legislators to read Blue World’s posts!  Try as they might they cannot replace supply with legislation or demand with redistribution.  The laws of economics are simple.  Without demand there is no need for supply.  If there is no need for supply then there is no need to keep the work force you had, much less hire new employees.  If people aren’t working they don’t have buying power.  Now we are full circle to no buying power leaves us without demand.  Anyone who tries to make it more complicated than that may be any combination of ignorant, dishonest or, of course, an “expert!”

Investors, managers, entrepreneurs and business owners may do well to keep the defense on the field for the foreseeable future.

Thanks for reading and, please, stay tuned…

Release Site: www.bls.gov

Every effort is made to ensure accuracy of data transcription but accuracy cannot be guaranteed.  The official release site should be cross referenced.  The analysis represents the opinion of Blue World Asset Managers, Ltd. who does not warrant or guarantee predictions based on its analysis.

©Blue World Asset Managers, LTD Friday, May 04, 2012

The Confusion Suffered by “Experts” II – GDP April, 2012

Friday, April 27, 2012

Ignorance is curable. Stupid is forever.©

The Confusion Suffered by “Experts” II – GDP April, 2012

As our regular followers know we don’t usually do a post to analyze the GDP report in detail, because if we follow the monthly BLS Unemployment Report (www.bls.gov) the GDP is old news.  All the data we need to predict GDP (at least to an accuracy of worse, flat, better) can be found in the jobs data.  While today is no exception to the “no need to scrutinize” rule, we did feel a sense of obligation to comment on it due to the significant “unexpected” results reported today.  As we talked about today’s release it became apparent that what we had was a sequel to our post The Confusion Suffered by “Experts” from August, 2011.  It would be very helpful to review that post now so here’s the link. http://owl.li/ayFhe

Whenever we write experts in quotes you may assume we are saying the group or individual we are referring to is intellectually bankrupt (that means “moron”, “experts.”)   Why do we exhibit such loathing for the “experts?”  Because their financially or politically motivated spin analysis serves no useful purpose for those who invest real money, employ real people and are responsible for real performance.  In fact, it can lead to conclusions and decisions that are dangerous to a business.  And, of course, in some cases they’re just stupid.

So, why was the GDP report no surprise to us or our readers but was to so many “experts,” including the 85 economists (academics) polled by Bloomberg, for example?  Because they don’t compare what they see in the data of one report to the data published in other reports and view the full body of information through the prism of real life.  There was no defendable evidence that the GDP report was going to spike sharply or tank abruptly.  We predicted a flat to shallow downward move from Q4 ’11 and that’s what we got.  Kudos to those “experts” who also got it right.

The Confusion Suffered by Experts, referenced above, explains when and why some data releases lose their predictive value under certain macro conditions of the economy and, consequently, why it’s so silly to have wild market reactions to weekly data like first time unemployment insurance claims.

The Gross Domestic Product Report

We don’t need an in-depth tutorial on how to read the GDP report in order to follow this trail.  All we need to know is that there are 4 marquee headings that contribute to overall Gross Domestic Product.  They are:

  • Personal Consumption Expenditures
    • the total of what consumers spent
      • consumer spending is 70% of our economy
  • Gross Private Domestic Investment
    • the total of what private sector businesses spend on fixed assets
      • buildings, equipment, etc.
  • Net Exports
    • the net difference in value between what the U.S. sells and buys from other countries
      • Since the 70’s the U.S. virtually always has a trade deficit and that subtracts from total GDP
  • Government Spending
    • total spent by federal, state and local governments

Remember, no single number, data point or report is valuable unto itself.  Trends are what matter.  Here are some examples of the trends that irrefutably predicted an uninspiring GDP report.

There have been three unemployment reports since the last GDP estimate.  The key indicators that we can look at to get a sense of GDP are the following:

  • Total unemployed population
    • This is not the unemployment rate.  The unemployment rate has been very misleading lately.  See why at Why Does Blue World Keep Saying the Labor Market is not Improving http://owl.li/ayLvx
    • The total unemployed rose in one month and fell in another.  Coupled with a similar pattern in the total labor force size suggests an overall flat complexion so that would not predict an uptick in GDP
  • Unemployment Rate of Workers who are 25yoa+ with a Bachelor’s Degree or Higher
    • This group of professional, management, entrepreneurial and big ticket consumer types has been unemployed at rates never seen since records have been kept for nearly 3 years
    • Expansion requires managers, entrepreneurs and big spenders.  When the needle on this demographic is not trending to the right, GDP cannot advance aggressively.
  • Avg. Hours Worked per Week in Manufacturing
    • The number of hours worked in a week across the manufacturing sector is a major indicator of demand and, therefore, a great predictor of GDP.
    • In the last three months the most optimistic read is a flat work-week length.  This does not suggest GDP growth
  • Avg. Overtime Hours Worked per Week in Manufacturing
    • For corroboration and predictive analysis we review the need for Overtime Hours in manufacturing.  Even if the work week length is flat, if overtime is trending up it’s a good bet companies will need to start hiring soon.
    • Over the last several months O.T. hours in manufacturing have been completely flat and well below the number needed to presage the need for new workers.  This does not support confidence in GDP growth prospects.
  • Avg. Hours per Week in Construction
    • Flat at best
    • Need we go on?

Those are just a couple of examples of how one report can predict another report which is in stark contrast to the irresponsible reactions to shorter term output described in The Confusion Suffered by “Experts.”

Blue World has opined that recent increases in durable goods spending has been more about deferred expenditures than evidence of a true recovery.  This hypothesis is supported by the durable goods orders report from yesterday (4-26-12) that showed a slowdown of consumer and business spending on items built to last at least three years.  Blue World, therefore, expects a downward revision in that GDP category at the next estimate release on May 31, 2012.

The increase in consumer spending on non-durable goods (clothing, food, etc.) appears right in line with inflation so consumer spending is unimpressive and unconvincing.

Of particular note is the significant drop in business investment for the first quarter.  This, too, signals prior quarter’s strength was more attributable to spending that had been put off during the worst of the recession and just couldn’t wait any longer.

Another line item that we watch closely is the Change in Private Inventories line.  Inventories are goods that were produced but not sold.  They can give pretty good clues about supply and demand.  If inventories are striped out of the 2.2% GDP reported today the GDP growth drops to 1.6%.  We’ll need to watch this over the next two Q1 estimates because the big drop from Q4 inventory’s contribution to the total GDP percent change could signal the deferred expenditure buying spree for consumers and business is over with the jobs data, manufacturing in particular, showing new finished inventory is not being replaced as fast.

Government spending continues to decline and for very understandable reasons.  Remember, the government produces nothing.  Taxes are a levy.  They are not offered voluntarily in exchange for a product or service.  When the private sector suffers government has no choice but to suffer as well because private sector success is government’s only source of revenue.  This is why we keep yelling at the top of our lungs “POLICY MATTERS!!”

So, here ends the (first) sequel regarding the confusion suffered by experts.  We would be very proud, flattered and humbled if we could say we have prevented even a single person from becoming an “expert.”

We could never adequately express our appreciation of you for talking the time to read our posts.

Thank you.

Every effort is made to ensure accuracy of data transcription but accuracy cannot be guaranteed.  The official release site should be cross referenced.  The analysis represents the opinion of Blue World Asset Managers, Ltd. who does not warrant or guarantee predictions based on its analysis.

©Blue World Asset Managers, LTD Friday, April 27, 2012

Blue World Employment Situation Report Analysis September 2 2011

Blue World Employment Situation Report Analysis

Release Date:  Usually the first Friday of each month

Release Site: www.bls.gov

Market Sensitivity: VERY HIGH

Management Value: VERY HIGH

Friday, September 02, 2011

Brain surgery is not rocket science to a brain surgeon©

Mr. Obama’s jobs plan better be a jobs plan that includes excluding the government from any further “help.”  We already know we are going to hear about “stimulus” without calling it “stimulus.”  We are going to hear about “shovel-ready” without calling it “shovel-ready.”  We are going to hear about infrastructure, green, tax credits for hiring, etc.  The content of this jobs address has already been leaked and, unless you suffer from Alzheimer’s, the ideas being touted as new are not new.  In all fairness we can at least say euphemistic renovation of politically toxic buzz words won’t do any harm.  The fear must be that the proposed double-down will get implemented.  This is no longer theory, friends.  We have the original forecasts recorded.  We have a data pool deep enough for analysis and that analysis exposes unmistakable trends.  Those trends are bad. 

We don’t care what works as long as it works.  By “works” we mean an economy that is in aggressive growth mode with rising GDP, falling unemployment, increased productivity, increasing personal wealth and ever-rising optimism and morale that encourages an environment driven by personal responsibility and motivated by the idea that reward will be determined by effort.  In spite of some “experts'” proclamations to the contrary we have concluded that government spending and extended unemployment benefits will not promote those objectives.  We also maintain the administration’s definition of “works” differs from ours.

The Devil is always in the details.  We can begin with the downward revision of last month’s job gains.  The headliner rate remained at 9.1%.   The number of new jobs added; zero.  That means none lost (net) either.  Already some “experts” are saying “that’s great”, “it got no worse”, “we’re obviously turning the corner” and similar nonsense.  We’ve been reading this report for a long time, folks, and we’ve never seen “0” at the end of that table.  That, alone, is unsettling.  There are, however, some noteworthy and ominous signs in the numbers.  Those over 25 with a Bachelor’s and higher remain at a staggering 4.3%.  Black workers’ unemployed rate jumped .8% overall with black men 20+ posting  a horrifying full 1% jobless rate increase from 17% to 18% July to August.  Those numbers are bad enough.  The most concerning to us is the following: Goods producing, construction, manufacturing, retail and I.T. all posted net job losses. That has not happened in a long time.  In addition, the number of hours worked per week and the hourly rate of pay had been on a long, steady, albeit, uninspiring rise.  They both fell in August.   

 Businesses should not and will not hire while under a dark cloud of government animosity, regulatory uncertainty, high unemployment, tanking consumer confidence and deplorable demand conditions.  A $20k per year employee costs a business double that to employ.  No competent business manager is going to think a $2500 offset to a $40k loss is an incentive to hire.  Only a forecast of improving demand is an incentive to hire.  The government produces nothing, brings nothing to market and is not dependent on customer satisfaction for survival.  Many in government seem to think the private sector works the same way.  Hint:  It doesn’t.

If you missed our post on The Confusion Suffered by “Experts” the link is below.  It describes some reasons why so many headlines contain words like “surprised”, “unexpected” “shocked”, etc.

 http://owl.li/6jNBf

 For us, our clients and our readers we remain defensive with our market investments and do not anticipate a change in that posture in the absence of any evidence of significant policy change. 

 Thanks for reading and, please, stay tuned…

 Release Site: www.bls.gov

Every effort is made to ensure accuracy of data transcription but accuracy cannot be guaranteed.  The official release site should be cross referenced.  The analysis represents the opinion of Blue World Asset Managers, Ltd. who does not warrant or guarantee predictions based on its analysis.

©Blue World Asset Managers, LTD Friday, September 02, 2011

The Confusion Suffered by “Experts”

Tuesday, August 16, 2011

Brain surgery is not rocket science to a brain surgeon.©

The Confusion Suffered by “Experts”

We are being asked a question pretty routinely lately.  In our Tweets and our blog posts we always exhibit an enthusiastic irreverence for certain economists, market commentators, media personalities and politicians by identifying them as “experts.”  We go on to explain why what they said was silly.  We have little use or respect for those whose headlines routinely contain words like “unexpected”, “surprised”, etc.  We often review our past posts regarding our opinions on where the economy is headed to make sure we have had a good handle on what is going on or if we need to shift our observational and analytical methodology.  Ya see, “experts”, that’s what you do if your analysis, decisions and policy aren’t working.  We are pleased yet sad to say if you follow us none of the economic data that “surprises” the “experts” is ever a bombshell for you.  This has led many of our readers to ask Why are the “Experts” Always Wrong?

There are several reasons ranging from academically focused and financially motivated to politically goaded.  In other words we must always consider the source.  The financially and politically motivated crowd is, we believe, reasonably small.  Advocates of the party in power will try to up-spin data and market beneficiaries have a vested interest in making any news look as good as possible.  That leaves a much larger group that is just plain wrong.  Why are these “experts” so easily misguided by the same data we review?  We have a theory.  The problem is mostly academic.  Blue World employs people.  Blue World principals and network resources employ lots more people.  Blue World clients employ lots, lots more people.  Decisions on how many are employed is partially based on a comprehensive review of the economic data released, just like many of our “experts.”  The difference is we HAVE EMPLOYED REAL PEOPLE and INVESTED REAL MONEY to make businesses (our own and our client’s) successful in the private sector.  We don’t just sit in cubicles and read data.  We compare the data to what we see happening around us in the real world.  Just driving  around town or across the country and taking note of strip mall vacancies can give some great anecdotal corroboration or refutation of the spin in the headlines. 

Data is just that.  Data.  It should be used as a metric against which to measure reality.  If we don’t understand how the data is gathered we are likely to make poor decisions based on it AND be at the mercy of those who do know and choose to ‘spin.’  For example, the unemployment rate dropped .1% last month.  Good news, right?  Not if we know how to read the report.  The number of unemployed people actually rose but the sample size changed such that the number of people being counted shifted. This created an artificial improvement the percentage even though reality worsened.  This is an observation, not an accusation, but I’m afraid there is a degree of estimating that goes into the BLS Unemployment numbers, and that creates the opportunity to mislead at the headline.  That’s why Blue World does the monthly analysis, to remove the spin and provide actionable intelligence to business owners, managers and investors. 

Another example: a great deal of predictive emphasis is placed on the ADP job numbers.  As the largest payroll processor in the company it is assumed that an increase in processed paychecks equals positive private sector job growth.  The problem is that ADP counts all payrolls, not all workers.  In other words one worker may be holding down three part-time jobs because he can’t find full time employment.  This looks like three new jobs but it is only one person working!  This statistic is not accounted for in the ADP report but is in the BLS release.  It is called “Employed Persons at Work Part-Time for Economic Reasons.” “For Economic Reasons” means a worker wants full time work but can’t find it.  It is found in Table A: Household Data of the monthly BLS report.  If we see a rising trend in the ADP report and want to deduce good or bad news from it we must compare that to the trend of part-timers for economic reasons.  If that trend is also rising we don’t have a good trend for private sector employment.

We did a blog some time ago that shows how all of the economic reports out there have just one common goal.  They all seek to determine what our mood is.  That’s really it.  The full post is entitled Is There a Meaningful Economic Recovery Going on Out There? and can be found at http://ow.ly/4M2Dn It shows what we predicted for the economy over a year ago.  Sometimes it’s no fun to be right.   The most relevant passage to this post follows:

Now, there are boatloads of economic releases that come out each week, month, quarter, year.  There is GDP, the unemployment report, housing starts, consumer confidence index, new home sales, existing home sales, new housing permits, first-time jobless claims, factory orders, manufacturing index and on and on and on… What I want you to realize is that for all the data gathered, analyzed and reported on they all have just one common objective.  It is to see what kind of mood you and I are in as consumers.  If we can determine what kind of mood the consumers are in and what their spending patterns are we can predict which way the economy is likely headed.  If unemployment is headed down, personal income is increasing and GDP is rising it is a darn good bet that good times are-a-comin’.

Often times spin of the data is used to try to shape our mood rather than identify it.  Those who read the detail (or our analysis) are inoculated against such manipulation. 

So how are the truly unbiased “experts” fooled?  We have data that comes out weekly, like first-time unemployment insurance claims; monthly, like the Bureau of Labor Statistics (BLS) employment report; and quarterly, like the Gross Domestic Product (GDP) report.  All too often our “experts” use the weekly type releases as predictors of the longer term data.  The correlation during robust recovery and distinctly weakening times can be quite good.  At times of bouncing along the bottom or flying at cruising speed, however, the predictive value predictably deteriorates!  If all you do is sit in a cubicle and look at data (like our “experts”) you’re just going to be wrong due to the inconsistent and sometimes volatile nature of the more short term data.  To illustrate this point the graph below shows the average number of new unemployment insurance claims (weekly) graphed against the actual number of reported unemployed people (monthly) divided by 10 to match the scale. 


Source: www.bls.gov & www.dol.gov

As you can see, if you were to use even the weekly average new claims (blue line) to predict the unemployed totals (red line), you would regularly be “surprised.”  If you were to look for news, good or bad, in the actual weekly numbers you can appreciate that they are even more volatile and unpredictable than the smoothed-out average represented above.  That’s why we roll our eyes and shake our heads when the markets throw a party or a wake every Thursday when the new unemployment insurance claims are announced. 

Any one week, month or quarter’s data does not tell us anything in a vacuum.  Convincing medium to long-term trends coupled with real-world observations ranging from personal income and internal sales to store front vacancies and the mood of our neighbors are the only way to accurately assess the true health of the overall economy.  This type of ongoing observation and analysis of DATA AND THE REAL WORLD is the only way responsible investors, employees, managers and owners (remember that managers and owners are also employees) make decisions about their businesses.  We say brain surgery is not rocket science to a brain surgeon. I am certainly neither.  But even I can predict 9% unemployment, record foreclosures, rising food and gas prices, historically low interest rates, unfathomable Federal debt, ubiquitous commercial vacancies and an ever-weakening dollar do not add up to a recovering economy!  This is why I, and I suspect you, will NEVER be an “expert.”

© Tuesday, August 16, 2011Blue World Asset Managers