Blue World Jobs Report Analysis 08/03/2018

Blue World Employment Situation Report Analysis

Release Date: Usually on the first Friday of the month

Release Site: www.bls.gov

Market Impact: Usually Very High

Management Value: Critical

Date: August 3, 2018 

Brain Surgery is not Rocket Science to a Brain Surgeon©


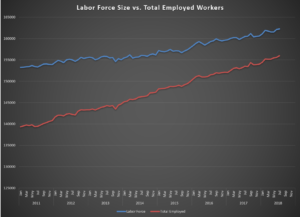
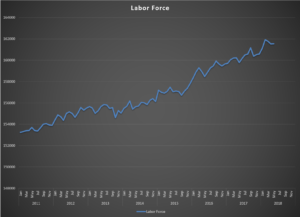
Job growth for the private sector continues to advance at an impressive pace. Even though the headline says 157k, the Private Sector grew by 170k as government got smaller by 13k payrolls. Add to that upward revisions to May and June of 59k and we’ve got a really hot labor market! Today’s graph is the Size of the Labor Force vs. Total Employed Workers, and it shows a decidedly expansionary pattern. Review this and our post “A Flute with No Holes is Not a Flute and a Recovery with No Jobs is not a Recovery” from 2012, and you’ll get a very good visual comparison.

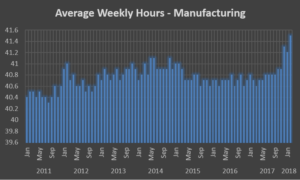
The Labor Force grew by 105k, Total Employed grew by 389k and Total Unemployed fell by 284k. The Participation Rate remains stubbornly below 63% at 62.9%, but the Diffusion Indexes show expansion in all private sector industries, including manufacturing, and not by a little. Remember, 50 is a break even on expansion. Both of these are holding in the mid-60’s.

The bellwether sectors of Manufacturing and Construction had another winning month, and part time workers for non-economic reasons are being hired at a break-neck pace (228k) in a mad dash to satisfy backlogs. The importance of that cannot be overstated.

Wages grew, but probably not enough to spook the hawks. That’s good. We still don’t believe inflation is a realistic threat to the expansion right now, and prophylactic moves to “head it off” are ill advised.

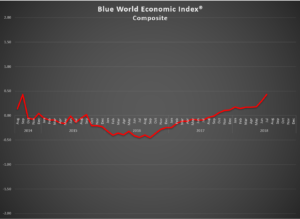
The jobs report is corroborated by the balance of economic reporting over the past month, including GDP. You can get a broader look at the economy at the Blue World Economic Index® report which posted earlier this week.

So far, so good in 2018. Expansion is the name of the game. Go for it with the right hand, but always keep the left hand near the brake with a watchful eye on the economy through us!

Matt is on real time today at 12:05p C on WBBM in Chicago to break it down live on the Noon Business Hour, AM780/105.9FM. If you miss it live you can get the Podcast later today.

The next jobs report is scheduled for September 7th. We’ll see you then. Have a great August!

As always, thanks for reading, and please stay tuned…

Release Site: www.bls.gov

Every effort is made to ensure accuracy of data transcription but accuracy cannot be guaranteed.  The official release site should be cross referenced. The analysis represents the opinion of Blue World Asset Managers, LTD. who does not warrant or guarantee predictions based on its analysis.


©Blue World Asset Managers, LTD Friday, August 03, 2018

Blue World Economic Index® Report for July 2018

Brief Explanation

Blue World Economic Index®

Scale: -2 to +2

Release Date:  Usually the Last or First Business Day of Each Month

Release Site: www.blueworldassetmanagers.com

Management Value: Critical

Date: Tuesday, August 31, 2018


Analysis

It’s that time of the cycle for the BWEI®. There are some major changes due to the quarterly trend analyses which always causes some turbulence, and this time was no exception and, in fact, perhaps the poster child..!  There were a couple of downgrades, but they were the overwhelming exception. We are very cautious about trend changes as they are weighted more heavily than the daily reports, so we tend to let them go a bit to make sure they have legs and that we are not hallucinating a direction.

The economy is just flat out humming, and that is reflected in the composite figures. As a matter of fact, there is only one of the eight Major Categories that remains in negative territory (Inflation), but even it made a Northerly move.

Tariffs have been a concern, but in the closing days of the month it seems they have begun to bear fruit. Please recall what Matt said on The Noon Business Hour last month when asked about the tariff issue. Tariffs can be used in two general ways. One is as actual tax policy and the other is for leverage in ongoing negotiations. In the case of this administration it is decidedly the latter, and despite all the tough rhetoric, the EU and China have taken steps in the direction of the negotiating table.

One report that needs special mention this month is GDP, which released last Friday the 27th. It came in at 4.1% which is huge anyway, but the really big news is that Inventories was a 1% drag on the total. Remember, GDP is the “stuff” that the economy “produced.” It doesn’t mean it got “sold.” We always check the Inventory component to determine the impact it had on the total. It can yield a skewed picture of the economy if GDP is big in part because inventories are up by a material amount in the face of weak sales. It means the “stuff” building up will have to be sold at discounts which hurts inflation, and retailers won’t be moving to replace the “stuff” or hiring more people to sell the “stuff.” In turn, manufacturers won’t be buying “stuff” to make “stuff” or hiring people to assemble “stuff”…so that hurts everything from employment to materials, and on and on throughout the economic web. That is decidedly not the case here. The drop in inventories is corroborated by other consumer spending and retail data from the past month, including today’s Personal Income and Outlays and Employment Cost Index reports.  Additionally, because the Inventories Report from the Census Bureau is a two-month lag, it points to a need to scramble to replenish the “stuff” because it is selling faster than it can be produced, which is a great outlook for the economy starting from employment and traveling all the way through. 

The Numbers

As mentioned above, seven of eight major categories are in the black, and that’s a first. The Composite Index shattered all prior records rising to .43 with advances in Employment, General Measures, Inflation, Manufacturing, Retail and Services. Consumer Measures and Real Estate both retreated a little bit, but the only one of any concern is Real Estate as there may actually be some trouble brewing there as six of nine reports posted negative scores. We’ll have to keep an eye on it.

Watch for the Blue World jobs report on Friday and then Matt goes on WBBM AM780 and 105.9FM at 12:05p Central in Chicago to break it all down live. If you can’t tune in you can get the Podcast here later in the day.

Have a great month and we’ll see you back here for the next BWEI® report at the end of August.


Every effort is made to ensure accuracy of data transcription but accuracy cannot be guaranteed.  The official release sites should be cross referenced.  The index assignments represent the opinion of Blue World Asset Managers, Ltd. who does not warrant or guarantee predictions based on the index.

©Blue World Asset Managers, LTD Tuesday, July 31, 2018

Blue World Jobs Report Analysis – June 1, 2018

Blue World Employment Situation Report Analysis

Release Date: Usually on the first Friday of the month

Release Site: www.bls.gov

Market Impact: Usually Very High

Management Value: Critical

Date: June 1, 2018

Brain Surgery is not Rocket Science to a Brain Surgeon©


The report looks great at the headline and most of the detail backs it up. There are a couple of rough spots in the usual places so let’s take a look.

The headline posted 223k net jobs added and the private sector accounted for 218k of those which keeps the 2018 average above 200 and revisions to March and April netted us 15k. The Total Employed rose and the Total Unemployed fell while the Labor Force got a little bigger.

The Participation Rate and Not in Labor Force stats remain stubborn with the former falling a tick and the latter rising for a third straight month and flirting with 96M. The baby boomers retiring is certainly a factor but that bleeding has got to be slowed.

Trade and Transport, Retail, Services, Manufacturing and Construction were all big gainers and wages showed some signs of life with Y/Y up 2.7% for hourly employees and a full 3% for salaried workers. The work week was 34.5 hours long for May which is exactly the average for 2018 to date vs. 34.4 hours for 2016 and 2017.

A stat that is not highlighted too much outside of Blue World’s report is actually the big indicator today. The Diffusion Indexes have remained above 60 for three months in a row. That hasn’t happened in a while and is a great indicator of underlying strength in the labor markets.

Because they are both due today, we’ll combine jobs analysis with a summary of May’s Blue World Economic Index® which actually hit .2 intra-month for the first time since we’ve been publishing it, but just couldn’t hold that level as the Real Estate major category took a beating in the final week. Regardless, the index did advanced to .18, matching the recovery record high set in January of this year.

Matt will be on AM780 and 105.9FM in Chicago at 12:09 today to break down the jobs report live and the Podcast can be found later this evening.

Thanks for reading, and please stay tuned…

Release Site: www.bls.gov

Every effort is made to ensure accuracy of data transcription but accuracy cannot be guaranteed.  The official release site should be cross referenced. The analysis represents the opinion of Blue World Asset Managers, LTD. who does not warrant or guarantee predictions based on its analysis.

 ©Blue World Asset Managers, LTD Friday, June 01, 2018

Blue World Jobs Report Analysis March 9, 2018

Blue World Employment Situation Report Analysis

Release Date: Usually on the first Friday of the month

Release Site: www.bls.gov

Market Impact: Usually Very High

Management Value: Critical

Date: Friday, March 09, 2018

Brain Surgery is not Rocket Science to a Brain Surgeon©


BRACE YOUSELVES…

WE CAN’T FIND ANYTHING “WRONG” WITH IT!!!

And you know we try! So often is the case that the headlines are contradicted by the detail the deeper we push into the weeds. This works in both directions and for any report, not just jobs. This report has a couple of “weaker” spots but no “weak” ones. We’ll start with those.

Overall, Weekly Hours Worked and Wages were essentially up-less-than-expected to flat as was the number of Unemployed. That’s it.

The Participation Rate bridges the gap between “weak” and “strong” by straddling the line, in as much as 63% is still unacceptably low, but it moved .3% to the North in a single month. You may recall we were horrified the last time it moved that much from one report to the next. We called it virtually unprecedented, and it moved the wrong way. Not this time!

The headlines screamed 313k of which 287k came from the Private Sector. That, plus upward revisions to December 2017 and January 2018 of +54k, brings the 2018 monthly average to the mid-200’s.  The Labor Force grew by an impressive and refreshing 806k. Total Employed grew by 785k, and the Not in Labor Force tally fell by a fabulous 653k. That’s huge. The Diffusion indexes for the Total Private Sector and Manufacturing are massive and flirting with 70. For reference, we saw 30s not so long ago.

Now, let’s get back to hours and wages. There is concern from the “experts” out there this morning that there is still no sign of wage pressure. Au contraire! I guess they just don’t know their way around the deep weeds like we do… Review Table B-3 of the Report. Average Hourly Earnings for All Employees M/M and Y/Y were up .1% and 2.5%, respectively. Both were below most consensus estimates. BUT, Average Weekly Earnings were up 3.1% Y/Y so salaried employees seem to be on the move so Hourly will follow if this holds. Even more important, compensation in the Construction industry came in at Y/Y increases of 3.5% and 4% for Hourly and Weekly, respectively. In our relative world of the past ten years, those are pretty good numbers. The work week for all employees remained range-bound but Weekly Hours in Manufacturing jumped from 41.2 hours to 41.5 hours. That is the highest reading since before 2011 (Chart) and Overtime in Manufacturing hit 3.6 hours. That is only the second time since 2011.

Risks? First and foremost is still the Fed. We don’t want to see rate hikes in anticipation of inflation. We need to see some consistent evidence and inter-report confirmation lest we risk locking up the economic brakes. Second, this report may set unrealistic expectations. A reading of say, 230k in the Private Sector next month may not look so good compared to today’s outsized numbers. Also, beware of revisions. We see them be material time and time again. Today is a great example. Optimism, when supported by trending data, is OK when making strategic business decisions. Euphoria is just plain dangerous!

Matt will be on WBBM’s Noon Business Hour in Chicago at 12:09 CST to break it all down live. That’s AM780 and 105.9FM and the Podcast will post later in the day.

If you missed it, you can review the Blue World Economic Index® for February 2018. We’ll see you back here around the first of April for the next BWEI® Report and the jobs report for March is schedule for release on Friday, April 6th.

Have a great March and may your brackets prove un-bustable!!

Thanks for reading, and please stay tuned…

Release Site: www.bls.gov

Every effort is made to ensure accuracy of data transcription but accuracy cannot be guaranteed.  The official release site should be cross referenced. The analysis represents the opinion of Blue World Asset Managers, LTD. who does not warrant or guarantee predictions based on its analysis.


©Blue World Asset Managers, LTD Friday, March 09, 2018

Blue World Economic Index® for February 2018

Brief Explanation

Blue World Economic Index®

Scale: -2 to +2

Release Date:  Usually the Last or First Business Day of Each Month

Release Site: www.blueworldassetmanagers.com

Management Value: Critical

Date: Thursday, March 01, 2018


Analysis

Confirming our regular observation that stock market performance is not a good proxy for economic health, the U.S. economy remained firmly on solid ground in February 2018 pulling back .04 from its record high .18 for December to its prior record high of .14, but there were some hints at trouble. The first half of the month looked to continue an uninterrupted northerly trend, but then mid-month started getting weird with a huge downgrade to December retail, soft January readings and a sudden build to inventories at the manufacturer and wholesale levels. Retailer inventories remained low, but the obvious concern now is that the motivation to aggressively re-stock may be muted.

The Inflation composite was unchanged at a continued weak -.23. The PPI had been showing signs for months, but the CPI just never followed suit. This month it was the CPI showing a material pop and the PPI showing weakness. The Fed is signaling more rate hikes, and that has spawned “Correction Part Deux” this week. We remain of the opinion that inflation is not a material risk at present based on the inconsistent and non-confirmatory nature of the six reports that comprise the BWEI® Inflation component.

While we still consider the Fed to be the biggest risk to the economy right now, there are several other things we could talk about but only two of real note. First is that the Consumer component is still stratospheric, regularly setting new records, and showing no sign of slowing. Second is the seemingly emergent turbulence in Real Estate as (you guessed it) rates rise. We are starting to see corroboration in other subtle corners of the economy such as the wobbly performance of furniture sales in the last couple of months. 

We’ve already fielded a couple of questions regarding the downward revision to GDP. Fuggetaboudit. The downgrade was largely based on the inventory phenomenon and a blip widening of the trade gap as exports took a hit. That masked what was an otherwise 4%+ report.

The Numbers

We got a little long-winded in the analysis section, so instead of listing out the numbers we decided to just post the composite table for the month. If there are any specific questions, give us a call or ping us through the Blue World contact form.

The jobs report has been scheduled for Friday, March 9th. Our analysis will be up that morning and then Matt will go on the air in Chicago with the Noon Business Hour crew at WBBM AM780 and 105.9FM at 12:09 central time to break it down live. The podcast will post later in the day.


Have a great March and may your brackets be un-bustable!!


Every effort is made to ensure accuracy of data transcription but accuracy cannot be guaranteed.  The official release sites should be cross referenced.  The index assignments represent the opinion of Blue World Asset Managers, Ltd. who does not warrant or guarantee predictions based on the index.

©Blue World Asset Managers, LTD Thursday, March 01, 2018