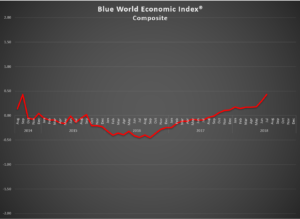
Blue World Economic Index®
Scale: -2 to +2
Release Date: Usually the Last or First Business Day of Each Month
Release Site: www.blueworldassetmanagers.com
Management Value: Critical
Date: Tuesday, August 31, 2018
Analysis
It’s that time of the cycle for the BWEI®. There are some major changes due to the quarterly trend analyses which always causes some turbulence, and this time was no exception and, in fact, perhaps the poster child..! There were a couple of downgrades, but they were the overwhelming exception. We are very cautious about trend changes as they are weighted more heavily than the daily reports, so we tend to let them go a bit to make sure they have legs and that we are not hallucinating a direction.
The economy is just flat out humming, and that is reflected in the composite figures. As a matter of fact, there is only one of the eight Major Categories that remains in negative territory (Inflation), but even it made a Northerly move.
Tariffs have been a concern, but in the closing days of the month it seems they have begun to bear fruit. Please recall what Matt said on The Noon Business Hour last month when asked about the tariff issue. Tariffs can be used in two general ways. One is as actual tax policy and the other is for leverage in ongoing negotiations. In the case of this administration it is decidedly the latter, and despite all the tough rhetoric, the EU and China have taken steps in the direction of the negotiating table.
One report that needs special mention this month is GDP, which released last Friday the 27th. It came in at 4.1% which is huge anyway, but the really big news is that Inventories was a 1% drag on the total. Remember, GDP is the “stuff” that the economy “produced.” It doesn’t mean it got “sold.” We always check the Inventory component to determine the impact it had on the total. It can yield a skewed picture of the economy if GDP is big in part because inventories are up by a material amount in the face of weak sales. It means the “stuff” building up will have to be sold at discounts which hurts inflation, and retailers won’t be moving to replace the “stuff” or hiring more people to sell the “stuff.” In turn, manufacturers won’t be buying “stuff” to make “stuff” or hiring people to assemble “stuff”…so that hurts everything from employment to materials, and on and on throughout the economic web. That is decidedly not the case here. The drop in inventories is corroborated by other consumer spending and retail data from the past month, including today’s Personal Income and Outlays and Employment Cost Index reports. Additionally, because the Inventories Report from the Census Bureau is a two-month lag, it points to a need to scramble to replenish the “stuff” because it is selling faster than it can be produced, which is a great outlook for the economy starting from employment and traveling all the way through.
The Numbers
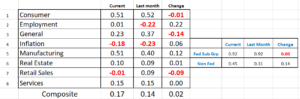
As mentioned above, seven of eight major categories are in the black, and that’s a first. The Composite Index shattered all prior records rising to .43 with advances in Employment, General Measures, Inflation, Manufacturing, Retail and Services. Consumer Measures and Real Estate both retreated a little bit, but the only one of any concern is Real Estate as there may actually be some trouble brewing there as six of nine reports posted negative scores. We’ll have to keep an eye on it.
Watch for the Blue World jobs report on Friday and then Matt goes on WBBM AM780 and 105.9FM at 12:05p Central in Chicago to break it all down live. If you can’t tune in you can get the Podcast here later in the day.
Have a great month and we’ll see you back here for the next BWEI® report at the end of August.
Every effort is made to ensure accuracy of data transcription but accuracy cannot be guaranteed. The official release sites should be cross referenced. The index assignments represent the opinion of Blue World Asset Managers, Ltd. who does not warrant or guarantee predictions based on the index.
©Blue World Asset Managers, LTD Tuesday, July 31, 2018