Blue World Jobs Report Analysis – February 02, 2018

Blue World Employment Situation Report Analysis

Release Date: Usually on the first Friday of the month

Release Site: www.bls.gov

Market Impact: Usually Very High

Management Value: Critical

Date: February 2, 2018

Brain Surgery is not Rocket Science to a Brain Surgeon©


The ugly, the bad, and the good sums up the employment picture for January 2018. The headline looks good, but there is some real stinky stuff under the surface so here we go…

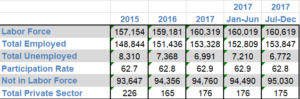
November and December were revised down a net 24k. The Not in Labor Force total and, consequently, the Participation Rate are ridiculously stubborn, having added 153k and remaining at 62.7% respectively. Weekly pay for the Private Sector, Construction, and Manufacturing all receded, and the workweek got shorter in total and for Manufacturing and Construction. That all seems reasonably confirmatory of the Productivity and Costs report released Thursday that showed productivity down but unit labor costs up in Q4 2017, as hourly pay did increase. Sounds pretty bad, right? Not so fast!

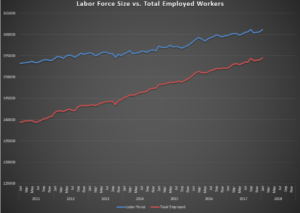
The headline boasts 200k net new hires which easily beats the consensus averages and of those a whopping 196k were added in the Private Sector. The Labor Force grew by 500k, and the Total Employed was up 400k. That’s today’s graph and we can see the lines are moving the right direction and showing some convergence. That’s good. Other anecdotal data points out there suggest some of the stinky stuff above will experience some positive revisions over the next 3 months, and we will begin to see the impact of the tax reform trickling in next month.

All in all, we are in good keeping with last month’s report describing 2017 as “mixed.” It still is. But keep in mind what an improvement that is from where we’ve been in the not-too-distant past.

To answer the three most frequent questions we field of late, ride the stock market wave, but DO NOT pull down the safety nets. Stop orders, inverse ETFs, index Put options, alone or in combination, are all good hedge vehicles depending on the structure of the portfolio. Give us a call if you’d like more detailed thoughts. In small and mid-size firms, be leaning in the direction of growth vs. cash stockpiling for rainy days, but make sure you move on quantifiable demand as opposed to getting out over the skis on speculation alone. Bitcoin? No.


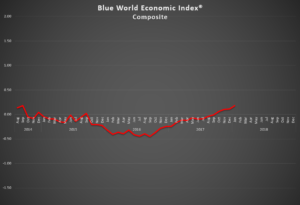
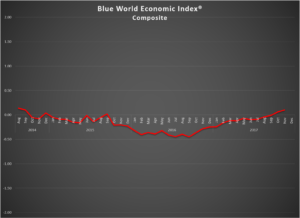
That’s it for this month. See you at the month’s end for the next Blue World Economic Index® report, which posted a record high for January and got off to a great start for February, and the next Jobs Report is scheduled for…wait for it…Friday, March 9th. Doesn’t that sound wonderful?!?

Thanks for reading, and please stay tuned…

Release Site: www.bls.gov


Every effort is made to ensure accuracy of data transcription but accuracy cannot be guaranteed.  The official release site should be cross referenced. The analysis represents the opinion of Blue World Asset Managers, LTD. who does not warrant or guarantee predictions based on its analysis.


©Blue World Asset Managers, LTD Friday, February 02, 2018

Blue World Economic Index® for January 2018

Brief Explanation

Blue World Economic Index®

Scale: -2 to +2

Release Date:  Usually the Last or First Business Day of Each Month

Release Site: www.blueworldassetmanagers.com

Management Value: Critical

Date: January 31, 2018


Analysis

What else can be said? The economy is on the move. The BWEI® made a material move to the North this month, and much of that was based on quarterly reviews of the twelve and twenty-four month trends which are more heavily weighted when calculating the index value. An upgrade of the ADP 1-year trend from -.5 to .5 was particularly impactful.  Within the Consumer Major Category, the TD Ameritrade IMX demanded trend upgrades as did Investor Confidence, while the Bloomberg Consumer Comfort Index set a monthly average record high.

We continue to feel the momentum is real but fragile and subject to political, economic, and policy risk, not the least of which is an apparent bias toward prophylactic rate increases in anticipation of inflation. The Hawks need to stand down for a while and let this thing develop. Uncertainty about the outcome of investigations is causing hesitancy as the world frets about whether the guy whose policies sparked the move will make it through a full term.

There was a great deal of anticipation regarding the Employment Cost Index report that came out Wednesday morning, but we don’t know why. This is a quarterly report which won’t take the effects of the post-tax reform wage increases into effect until Q2 of 2018. In spite of that, one can hallucinate a slightly positive trend developing already. Matt talked about the impact of tax reform on WBBM’s Noon Business Hour in Chicago on January 11th. You can follow the link, scroll down to the 11th and Matt starts at 2:20 into the podcast. 

The Numbers

The index advanced .06 to .18 (rounded) from .11. That ties the all-time record high set in September of 2014.

Employment, Inflation and Services remain painted in red ink where Employment showed material improvement, Inflation retreated fractionally, and Services were still stubbornly unchanged. Consumer, General Measures, Manufacturing, Retail, and Real Estate are positive where all padded their leads except Manufacturing and Retail, which showed fractional slips. The Manufacturing pullback was actually welcome as the Fed sub-group surveys came back down to solid yet sustainable levels of strength.

ADP was huge Wednesday morning. Let’s see if it translates to the BLS out this Friday the 2nd of February. The Blue World Jobs Report Analysis will be out before noon Friday. See you there and have a great month!


Every effort is made to ensure accuracy of data transcription but accuracy cannot be guaranteed.  The official release sites should be cross referenced.  The index assignments represent the opinion of Blue World Asset Managers, Ltd. who does not warrant or guarantee predictions based on the index.

©Blue World Asset Managers, LTD Wednesday, January 31, 2018

Blue World Employment Situation Report Analysis for January 5, 2018

Blue World Employment Situation Report Analysis

Release Date: Usually on the first Friday of the month

Release Site: www.bls.gov

Market Impact: Usually Very High

Management Value: Critical


Date: Friday, January 05, 2018


Brain Surgery is not Rocket Science to a Brain Surgeon©


And with that, the 2017 employment data is in the books! How was it? As usual, it depends on which “experts” we’re listening to. If political…which side? If cubical denizen economists…which side? If media…which side? If financial industry…which side? And if Krugman…well, Paul, ahhhhhhhh, Paul!

But if you’re listening to Blue World, who couldn’t care less about spinning the results, and you’re strictly focused on how the labor picture reconciles with what you see from the level of your real business that employs real people every day and want to make strategic decisions based on unbiased data analysis, then “How was it?” doesn’t depend on anything other than “How it was!” So, all that said, how was it? A very solid “mixed”…but leaning forward. Let’s dig into it.

We won’t spend a lot of time on December 2017 because it fits well with the rest of the year. We’ll just call it mixed, like all of 2017, and point out the positives are the Labor Force and total Employed rose, while total Unemployed fell. The Diffusion Indices for the total Private Sector as well as Manufacturing remained comfortably in the expansion range well above 60. On the down side, the Participation Rate remains below 63%, and the Not in Labor Force totals, while showing some sign of flattening earlier in the year, continue to creep upward. That is probably the biggest disappointment of 2017.

To the extent the Employment Situation report is both forward and lagging, there is value in comparison. We always say, “One report unto itself is meaningless. It is the trend that matters.” With that in mind, the table above compares selected key data sets we use to analyze the reports month in and month out. Included are 2015, 2016, 2017, and the first and second six months of 2017. Some of the data is significantly improved and headed the right direction, while some is not as exciting, but we will say if the positives keep moving in their current trajectories they will pull the others along. We were just hoping to see that phenomenon develop during 2017.

We did not get the Blue World Economic Index® posted this month, but we can tell you it advanced further into positive territory, ending at .11. The index continued to climb all year and averaged a -.06 for 2017 vs -.11 and -.37 for 2015 and 2016, respectively so there is NO question the economy is moving. The biggest problem we see for 2018 is a Fed that seems hell-bent on raising rates in the absence of any consistent inflationary pressure. We’ll be watching that closely in the coming year and, of course, let’s keep close eye on the portfolios as the markets continue to ignore past record highs in favor of new ones. If you want some ideas on safety nets, give us a shout.

Have a wonderful and profitable 2018 and we’ll see you back here at the end of January.

Thanks for reading, and please stay tuned…

Release Site: www.bls.gov


Every effort is made to ensure accuracy of data transcription but accuracy cannot be guaranteed.  The official release site should be cross referenced. The analysis represents the opinion of Blue World Asset Managers, LTD. who does not warrant or guarantee predictions based on its analysis.


©Blue World Asset Managers, LTD Friday, January 05, 2018

Blue World Jobs Report Analysis 12/08/2017

Blue World Employment Situation Report Analysis

Release Date: Usually on the first Friday of the month

Release Site: www.bls.gov

Market Impact: Usually Very High

Management Value: Critical

Date 12/08/2017 

Brain Surgery is not Rocket Science to a Brain Surgeon©

It’s good. There was some positive movement in some key areas and some others were essentially flat, but no huge negatives were hiding in the weeds, and that’s a welcome circumstance.

Starting on the weaker side, Total Unemployed and Not in Labor Force grew a bit, and the Participation rate was flat to October at a below 63% reading. The Private Sector added fewer jobs than last month, BUT it was still over 200k, which is a perfect segue into the stronger side of the report. The Labor Force and Total Employed tallies grew, revisions to September and October were net positive, the work week made it to 34.5 hours for the third time this year, and the Diffusion Indexes for both the Total Private Sector and Manufacturing industries remained very high.

Rate hike? We continue to hope not. There is meat for the hawks and doves in this report. We are focused on wages which, with just about every other reading, do not signal inflation. We, of course, recognize the legitimacy of the hawks’ attention to overall employment, and we suspect that may carry the day.

We’ll see you back here at the beginning of 2018 with the Blue World Economic Index®. The final BLS jobs report for 2017 is scheduled for release on Friday, January 5th 2018. Have a very Merry Christmas and Happy New Year!!

Thanks for reading, and please stay tuned…


Release Site: www.bls.gov


Every effort is made to ensure accuracy of data transcription but accuracy cannot be guaranteed.  The official release site should be cross referenced. The analysis represents the opinion of Blue World Asset Managers, LTD. who does not warrant or guarantee predictions based on its analysis.


©Blue World Asset Managers, LTD Friday, December 08, 2017

Blue World Economic Index® Report for November 2017

Brief Explanation

Blue World Economic Index®

Scale: -2 to +2

Release Date:  Usually the Last or First Business Day of Each Month

Release Site: www.blueworldassetmanagers.com

Management Value: Critical

Date 11/30/2017

Analysis

The BWEI® extended the winning streak and pushed higher into positive territory closing November 2017 at .1. There is still some hurricane influence in there, as some reports are a full two months lagging, but that doesn’t diminish the strength we see, and where hurricanes were still a factor our discretionary values remained largely unchanged.

We know Consumers are still in a good mood even without benefit of the weekly Bloomberg Consumer Comfort report, which didn’t post the last two weeks. That won’t have a material impact on that category. Not surprisingly the Las Vegas Strip Revenues suffered in October, but are holding on to a slight gain for fiscal YTD. Retail slipped fractionally, but that was expected as the hurricane blips wash through. GDP caused an optimistic stir, posting better than 3%. We are as pleased as anyone to see it, but any time inventories make a material contribution we have to be cautious because it’s a while before we see if the build is paced/justified by sales. At this point, the majority of reports lean in the right direction.

Will there be a rate hike? We’re afraid so. This appears to be a Fed looking for any excuse to move rates. For example, they will likely focus on the PCE and Personal Income headlines in today’s Personal Income and Outlays report showing a move in PCE and a bump to income. The detail, however, shows the PCE move to be tiny, and the income increase coming from interest income, while wages and salaries were on the soft side. We just don’t see enough consistency across the six reports followed in the Inflation category to warrant such hawkish policy.

The Numbers

Of the eight major categories, five are positive, three negative, and no break-evens this month. In spite of the hoopla, Employment and Inflation remain stubbornly negative at -.23 and -.26 respectively, with Services flat to October at -.11 but showing some signs of life. Consumer, General Measures, Manufacturing, Real Estate, and Retail are all comfortably in the black with retail being the only one of the plus group to lose any ground, which was explained above. Manufacturing is beyond belief (almost literally), as that category composite sits at a pack-leading .49, where the Fed sub-group is at 1, and the non-fed group is up to .41 with improvements of .05 and .06 respectively from October readings. We hope to see additional corroboration in the Employment Situation report due out next Friday the 8th.

Is the market overheated? Yes. But that’s been true for five years. Our strategy is to have appropriate safety nets strung and keep riding the wave. If you’d like some thoughts on that, give us a shout. Other than that, see you next week for the Blue World Jobs Report Analysis!

Every effort is made to ensure accuracy of data transcription but accuracy cannot be guaranteed.  The official release sites should be cross referenced.  The index assignments represent the opinion of Blue World Asset Managers, Ltd. who does not warrant or guarantee predictions based on the index.


©Blue World Asset Managers, LTD Thursday, November 30, 2017