Blue World Economic Index® for June 2016

Brief Explanation


Blue World Economic Index®

Scale: -2 to +2

Release Date:  Usually the Last or First Business Day of Each Month

Release Site: www.blueworldassetmanagers.com

Management Value: Critical

Release Site: www.blueworldassetmanagers.com

BWEI 6-16


Thursday, June 30, 2016

According to the Blue World Economic Index®, June 2016 was NOT a good month for the economy.  The index slipped from -.32 to -.41 and not only were the monthly readings weak, but a quarterly review of the recent and longer term trends yielded some downgrades. With half of 2016 in the books the Index average is materially lower than the average for 2015 running .26 lower at -.37.

Seven out of eight major categories were negative this month (welcoming another category to the red ink congregation) with Employment and Manufacturing continuing to be the weakest areas.  Real Estate was the only positive category but even it lost ground from May to June 2016.  The Consumer category saw an improvement but still could not achieve black ink status.

Without the full impact of Brexit or any hint of significant policy change on the horizon, our outlook regarding material improvement to the BWEI® is rather grim.

Watch for the Blue World Jobs Report Analysis out next Friday the 8th and Matt will be analyzing it live on CBS Chicago’s Noon Business Hour at 12:09pm central at WBBM AM780 and 105.9FM.

Have a wonderful and safe 4th!

Every effort is made to ensure accuracy of data transcription but accuracy cannot be guaranteed.  The official release sites should be cross referenced.  The index assignments represent the opinion of Blue World Asset Managers, Ltd. who does not warrant or guarantee predictions based on the index.
©Blue World Asset Managers, LTD Thursday, June 30, 2016

Blue World Jobs Report Analysis 06-03-2016

F v E 6-16


Blue World Employment Situation Report Analysis

Release Date: Usually on the first Friday of the month

Release Site: www.bls.gov

Market Impact: Usually Very High

Management Value: Critical

Friday, June 03, 2016

Brain Surgery is not Rocket Science to a Brain Surgeon©

OOOOOOOOOUCH!!

When it’s bad it’s bad, and this is bad without a scintilla of positive or even hopeful news. We keep saying “policy matters.” Yesterday our esteemed President spoke of the risk of losing the “progress” we’ve made, so we suppose he feels the majority of us have no interest in returning to the days of three percent plus growth in GDP, a healthy labor market, and men being expected to use the men’s room… He did, after all, see these figures yesterday.

The headline is devastating, and the detail is worse. The unemployment rate fell because the labor force shrank in much larger magnitude (-458k) than jobs were added (+38k), thus moving the lines in the above graph closer together, giving us an artificially low unemployment rate as has been the case now for an entire administration. The numbers for the private sector are worse. There were only 25k net hires, and of the 59k in downward revisions to the two prior months 58k came off of the private sector.

The Participation Rate has erased five months’ worth of gains, The Not in Labor Force total exploded by a breath-stealing 664 thousand, and Part Time for Economic Reasons was up almost a half million.

The Blue World Economic Index® remains in negative territory with stunningly impressive correlation to the Fed’s Beige Book, which eliminated any reference to growth as “moderate,” leaving only “modest” to describe what should be the world’s greatest economy.

We have been told of seven-year long “recoveries” that aren’t. We have been directed to accept abject mediocrity. We have suffered the redefining of terms like “recession” to fit a narrative that is dishonest, inaccurate, and causes continued, direct, and real harm to those who work, those who employ, and those who invest in a sincere effort to raise standards and improve lives. The data points reviewed above and going back many years now eviscerate that narrative. Defense is still the order of the day for business. A rate hike? We think not…but ya just never know… 

Policy matters.

Thanks for reading, and please stay tuned…

Release Site: www.bls.gov

Every effort is made to ensure accuracy of data transcription but accuracy cannot be guaranteed.  The official release site should be cross referenced. The analysis represents the opinion of Blue World Asset Managers, LTD. who does not warrant or guarantee predictions based on its analysis.


©Blue World Asset Managers, LTD Friday, June 03, 2016

Blue World Economic Index® for May 2016

Brief Explanation 

Blue World Economic Index®

Scale: -2 to +2

Release Date:  Usually the Last or First Business Day of Each Month

Release Site: www.blueworldassetmanagers.com

Management Value: Critical

Release Site: www.blueworldassetmanagers.com

 BWEI Chart May 2016

Wednesday, June 1, 2016

Apologies for the delay. We experienced a connectivity failure yesterday. The numbers recounted below reflect the close of the month of May 2016 with Farm Prices, a component of the Inflation category, being the last to report on 5/31/16 at 2:00pm CDT.

Less negative is the best that can be said for the U.S. economy according to the Blue World Economic Index® for May 2016 which came in at -.32, .07 better than April ‘16’s -.39. Compared to how the month started that is a bit of a relief.

Of the eight major categories, six checked in with below zero readings which is one worse than April as Services joined the underwater group. Of the five categories previously in negative territory Employment and Manufacturing deteriorated, General Measures, Inflation, and Retail improved while Real Estate and Consumer Measures padded their plus side showings. That represents a really nice recovery for the Consumer category as the first half of the month did not look good. The biggest concerns are the continued fall in Manufacturing even in energy dependent Fed regions despite increasing oil prices and a drop to negative for Services which had been the cornerstone of strength for the index. Due to the big tallies by Real Estate and Consumers, a record-setting low was happily avoided.

We maintain “hope” is not a responsible strategy for managing any business much less the economy but considering the policies in place and those being contemplated we have no choice but to hope those month-saving numbers represent a bounce, not a blip.

Don’t miss the Blue World Jobs Report Analysis out this Friday and may your June be a profitable June. We’ll do everything we can to help!

Every effort is made to ensure accuracy of data transcription but accuracy cannot be guaranteed.  The official release sites should be cross referenced.  The index assignments represent the opinion of Blue World Asset Managers, Ltd. who does not warrant or guarantee predictions based on the index.
©Blue World Asset Managers, LTD Tuesday, May 31, 2016

Blue World Jobs Report Analysis 05-06-2016

Blue World Employment Situation Report Analysis

Release Date: Usually on the first Friday of the month

Release Site: www.bls.gov

Market Impact: Usually Very High

Management Value: Critical

Friday, May 06, 2016

Brain Surgery is not Rocket Science to a Brain Surgeon©

Whoa Ugly


WHOA UGLY!!!                                (Full kudos if you email us with the movie)


The “experts” continue to baffle us… not really… Everyone is acknowledging the report is dismal, but we’ve already seen the “positives” in the report being touted by some “experts.” Well, if one only sits in a cubicle analyzing data, we suppose numbers are “positive” if above zero, but that does not necessarily translate to “positive” news on the economy for those who employ real people at real jobs for real wages in the real, outside-my-expert-cubicle world! Let’s dig in…

The headline is 160k, but the news is better for the private sector which came in 11k higher at 171k. If you wanted to leave after the good news…well…have a great weekend.  For the rest of us… Last month we reported the problem with the Private Sector counts being well below the headline and running at 195k for Q1 2016 vs. 222k for all of 2015. 222k is not stellar, but it is at least above 200k. The big news today is actually in the downward revisions to February and March 2016 of -14k and -11k, respectively, bringing the Private Sector average through April 2016 down to 183k. That just won’t get it done, folks.

The Labor Force got smaller, and the Not in Labor Force number got bigger, which ended the recent climb by the Participation Rate in spectacular fashion, which fell all the way back to 62.8%. What that means is that 37.2% of able-bodied, out-of-work Americans are not even participating in the jobs world.  That keeps the number of those not in the civilian labor force at over 94 million.

Some “experts” have said that revisions are minor. No they’re not. (See Private Sector revisions and averages above.)  Some “experts” have said that the news on wages was a positive because they are up .3% YTD and 2.6% since April of 2015.  Looks good from inside an “expert’s”  cubicle…unless, of course, one has reviewed AND remembers the Productivity and Costs report for Q1 2016 which came out a full 48 hours ago showing diminished output on higher pay driving productivity down and labor costs up. In order for wage pressure to be good news for a real manager of real people in the real world, more pay must translate to more productivity. This is why you follow us… The Labor Market Conditions Index will be out on Monday morning which the Fed follows closely. You can see our quick analysis on Twitter @BlueWorldMatt.

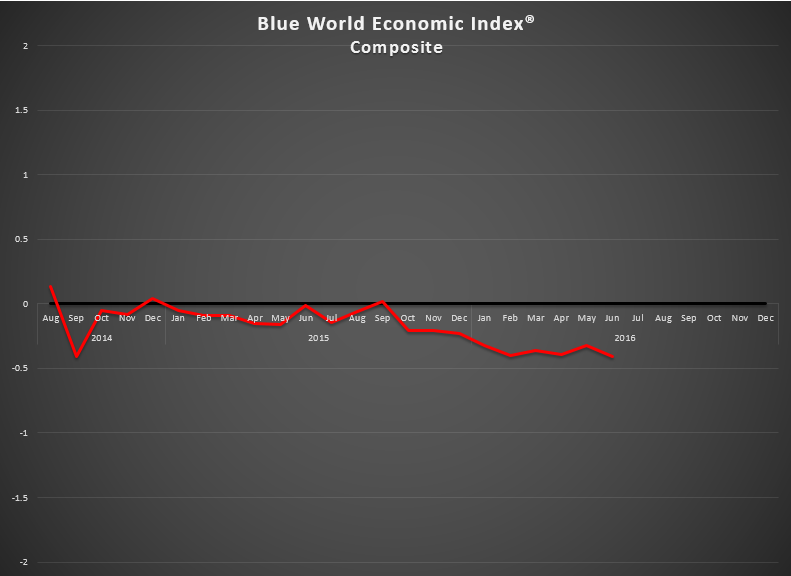
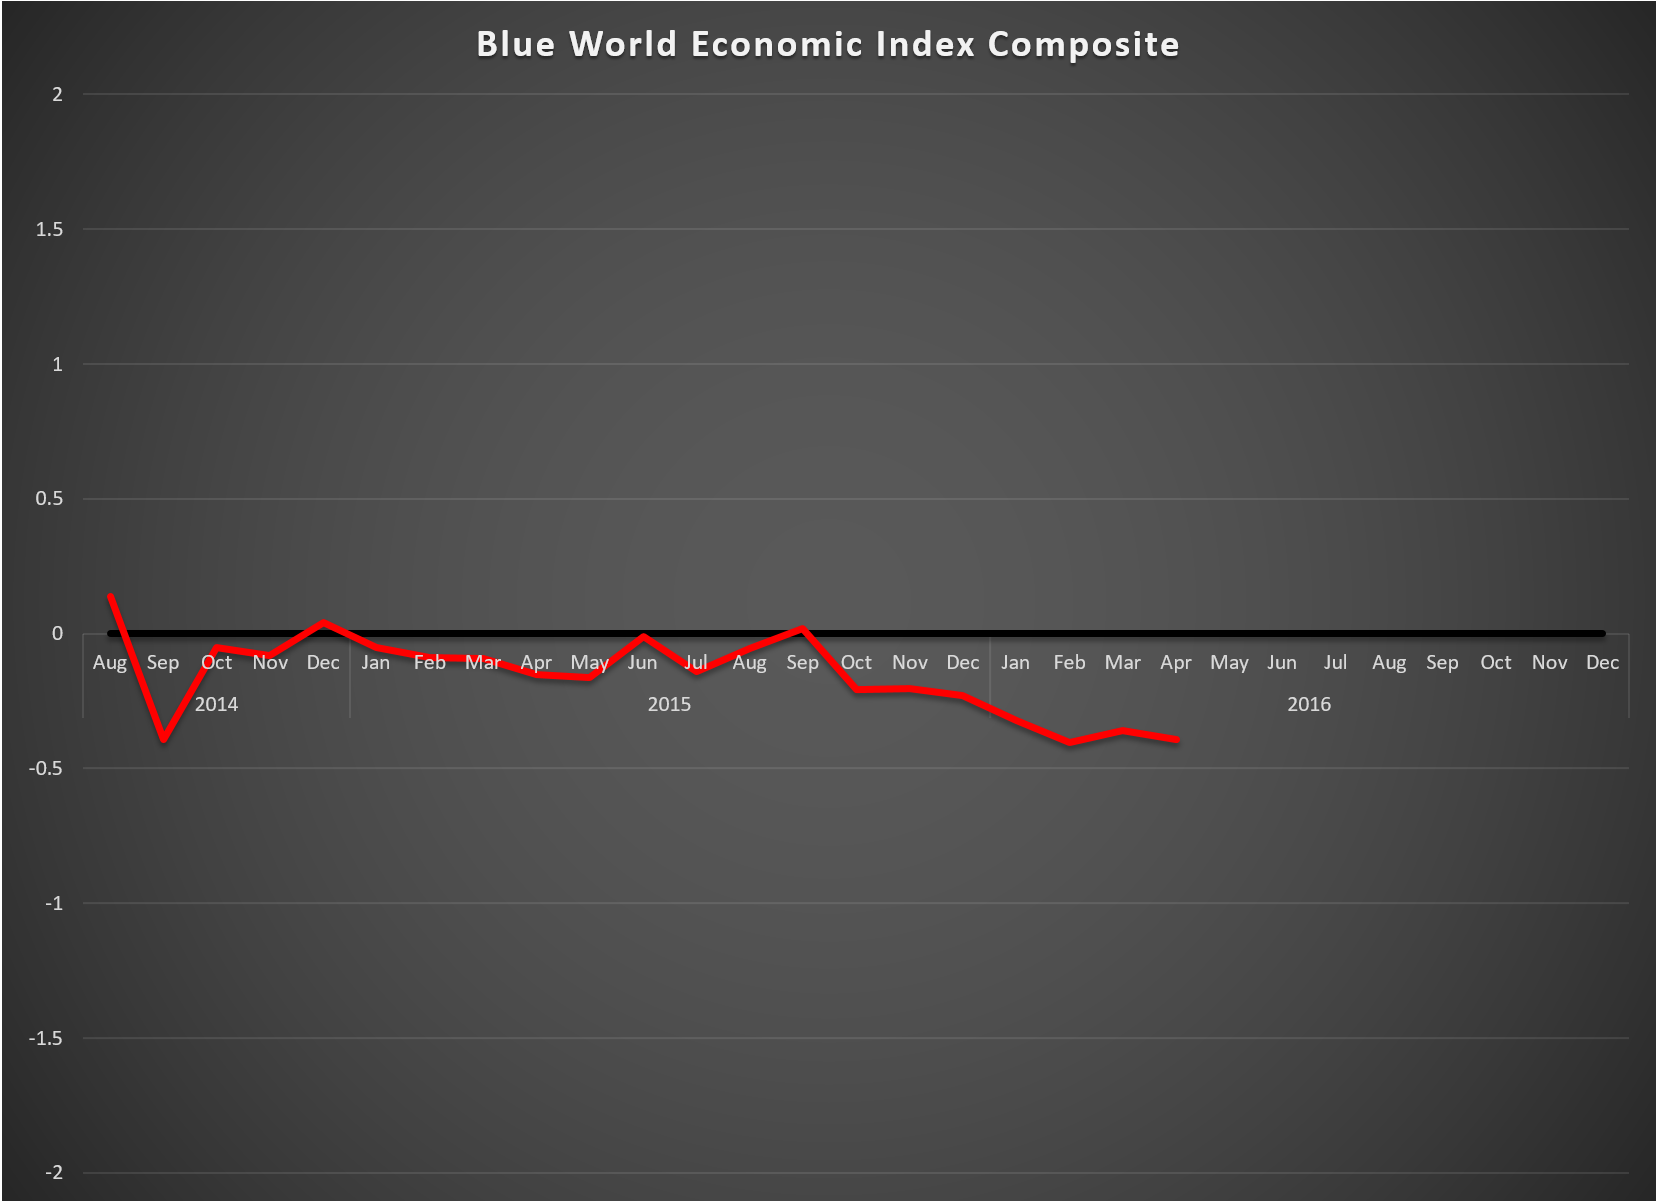
The Blue World Economic Index® has taken quite a hit in this first week of May 2016 falling from -.39 to -.44. A lot more data is still to come this month, so we don’t necessarily expect numbers quite that bad to hold but we are prepared to say the Fed meetings will likely be quite the yawners.

Thanks for reading, and please stay tuned…


Release Site: www.bls.gov


Every effort is made to ensure accuracy of data transcription but accuracy cannot be guaranteed.  The official release site should be cross referenced. The analysis represents the opinion of Blue World Asset Managers, LTD. who does not warrant or guarantee predictions based on its analysis. 
©Blue World Asset Managers, LTD Friday, May 06, 2016

Blue World Economic Index® for April 2016

Brief Explanation

Blue World Economic Index®

Scale: -2 to +2

Release Date:  Usually the Last or First Business Day of Each Month

Release Site: www.blueworldassetmanagers.com

Management Value: Critical

Release Site: www.blueworldassetmanagers.com

Friday, April 29, 2016

BWEI Graph 4-16


April started out with a little optimism as reporting from March hinted at some possible momentum, then the Empire State Manufacturing Survey kicked off the Fed district reporting at mid-month with solid positives, but it all went South in a hurry.

The BWEI® tied its lowest reading of -.39 since we started making the index available publicly in August of 2014.

Of the 8 major categories, 3 managed readings above 0 including Consumer Measures, which slipped a substantial .5 from .8 to .3.  Real Estate and Services join Consumer on the plus side of zero, and both showed fractional improvements over March. Employment, General Measures, Inflation, Manufacturing and Retail remain in decidedly negative terrain.

We don’t see the Fed making any big moves based on this data, which should make the markets happy but signal defense to those who manage real businesses and employ real people.

Look for The Blue World Jobs Report Analysis next Friday and have a great week.

Every effort is made to ensure accuracy of data transcription but accuracy cannot be guaranteed.  The official release sites should be cross referenced.  The index assignments represent the opinion of Blue World Asset Managers, Ltd. who does not warrant or guarantee predictions based on the index.
©Blue World Asset Managers, LTD Friday, April 29, 2016