Blue World Jobs Report Analysis for May 4, 2018

Blue World Employment Situation Report Analysis

Release Date: Usually on the first Friday of the month

Release Site: www.bls.gov

Market Impact: Usually Very High

Management Value: Critical

Date: May 4, 2016

Brain Surgery is not Rocket Science to a Brain Surgeon©


This one is decidedly mixed. There is some good and some bad in the places we’ve come to expect.

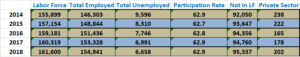
The headline came in at 164k, but the Private Sector actually added 168k as Government payrolls shed 4k. 168k is not stellar but well within most consensus ranges and keeps the 2018 average at 200k, but that is still on the strength of the incredible February numbers. If we adjust Feb to the average of the other three months the average drops to 160k, but the upward revision of 30k to the last two months helps the outlook. The Labor Force lost 236k, but the Number of Unemployed persons fell by the same amount.

Still disappointing, in our view, the Participation Rate fell to 62.8. There are those “experts” interpreting that as evidence of tight labor conditions when coupled with the diminishing Labor Force. While we get it, we have to take the more cautious approach of noting that the rise in the Not in Labor Force total exceeds the drop in Labor Force size, and there is still no meaningful wage pressure, so we still lean negative on the notion that employment is so great that employers can’t find workers. That’s a tough sell. As we’ve pointed out in the past, there is no such thing as a “jobless recovery.” Add to that, “there is no such thing as full employment without wage inflation.” If employers are adding workers and not having to pay more for them then supply is likely still high. In the Blue World Economic Index® report, posted Monday, we expressed our view that today’s jobs report would be the dove/hawk tie-breaker for the next Fed meeting as the quarterly Employment Cost Index report signaled wage inflation, but the monthly Personal Income and Outlays report did not. Today’s report definitely corroborates Personal Income and Outlays, so let’s hope the hawks remain perched.

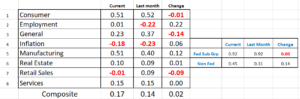
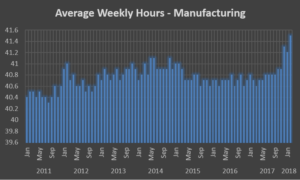
The Diffusion Indexes are still comfortably above 50 but posted their second monthly decline in a row and have fallen below their year-ago marks. Manufacturing and Construction had good showings again with regard to payrolls and wages, with Construction jumping 3.7% and 4.2% for Hourly and Weekly pay year over year.

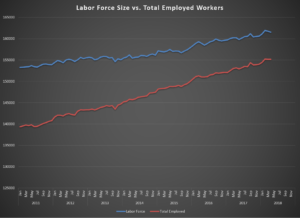
If we were pressed we’d say this report is mixed with a positive lean, but you know we don’t care about any single report, anyway. We care about the trends. In a post from October of 2012 entitled “A Flute with no Holes is not a Flute and a Recovery Without Jobs is not a Recovery”, we compared labor market charts from past recession/recoveries going back to the 70’s to show how the trends in a true recovery look. If we look at today’s chart we can see there is, in fact, finally a robust recovery under way.

Have a wonderful May and we look forward to posting the next Blue World Economic Index® report at the end of the month.

Thanks for reading, and please stay tuned…

Release Site: www.bls.gov


Every effort is made to ensure accuracy of data transcription but accuracy cannot be guaranteed.  The official release site should be cross referenced. The analysis represents the opinion of Blue World Asset Managers, LTD. who does not warrant or guarantee predictions based on its analysis.


©Blue World Asset Managers, LTD Friday, May 04, 2018

Blue World Economic Index® April 30, 2018

Brief Explanation

Blue World Economic Index®

Scale: -2 to +2

Release Date:  Usually the Last or First Business Day of Each Month

Release Site: www.blueworldassetmanagers.com

Management Value: Critical

Date: April 30, 2018


Analysis

Wait-and-see is the frustratingly common theme for the economy. The BWEI® for April’s report held strong and unchanged, but the ground beneath our feet still feels unsteady as lawyer’s files get seized, tariffs get implemented, porn stars get credibility, and investigators seek urine-soaked beds in Russian hotels… WOW!

There were a lot of conflicting signals this month, most notably from GDP, durables, and wages. The Employment Cost Index, a quarterly report, flagged wage pressure but that was not corroborated in the Personal Income and Outlays report, which issues monthly. The BLS jobs report Friday will probably break the tie and either feed the hawks or stroke the doves at next week’s FOMC meeting, as the most watched inflation measure tickles the target of 2%.  Spending strength in the current GDP report was offset by a down revision to February, and weakness was in key areas like computers and machinery. The only substantial agreement this month was with regard to strength in spending on services.

Strength is still very evident in many of the off-the-beaten-path reports like the Cass Freight Index which has shown steady and impressive results.

The Numbers

The index held at .17 where, except for Employment which fell back .11, all gains and losses were fractional. Employment and Inflation are the only two of the eight major categories in the red, and Consumer metrics are still far and away the leaders at a Category Composite of .51. For comparison, second place is Manufacturing at .44.

The Blue World Jobs Report Analysis will be out Friday morning. See you there! Have a great May. Hopefully it will only snow once in Chicago this month..!


Every effort is made to ensure accuracy of data transcription but accuracy cannot be guaranteed.  The official release sites should be cross referenced.  The index assignments represent the opinion of Blue World Asset Managers, Ltd. who does not warrant or guarantee predictions based on the index.

©Blue World Asset Managers, LTD Monday, April 30, 2018


Blue World Jobs Report Analysis 04-06-2018

Blue World Employment Situation Report Analysis

Release Date: Usually on the first Friday of the month

Release Site: www.bls.gov

Market Impact: Usually Very High

Management Value: Critical

Date: Friday, April 06, 2018 

Brain Surgery is not Rocket Science to a Brain Surgeon©

Cooling was expected but this was kinda weird. Once we look at all the net-nets it was a mixed report with an unmistakable positive lean even though the headline shows a substantial miss. Getting deep in the weeds and doing a lot more math than usual was key to understanding what this one really said. There are, of course, already thousands of “expert” “analyses” out there by both sides of the political aisle and financial industry with their own slants, so as always, read those for amusement and stay here for the actionable intelligence needed for strategic management decision making!

At the headline we see 103k whereas most consensus estimates called for 175k to 200k. The good news is that of the 103k, 102k were Private Sector adds which also picked up a positive revision from last month pushing the YTD 2018 average over 200k. Most of the positive developments from our go-to stats in last month’s monster report held up and wages hinted at some pressure. The work week length was steady and Manufacturing was a big winner again. The Diffusion Indexes returned from outer space but remained comfortably (and more sustainably) above 60. The table above shows annual averages back to 2014 for some of those key stats and you can see which are stubborn and which are making progress.

Concerns? A few. Retail got beaten up and that is consistent with yesterday’s Challenger layoffs report. Participation Rate and Not in Labor Force numbers continue to disappoint and there were too many Part-Time jobs but that tends to be volatile. We don’t think that this will force the hawks from their perch at the Fed so hopefully they’ll leave rates alone a while longer but they seem to look for any excuse these days.

Overall it was a good March for the economy. The Blue World Economic Index® made a nice move led by Employment and Manufacturing. Services looked good with rare and welcome tri-confirmation of strength despite slight pullbacks in ISM and PMI’s non-manufacturing reports.

From our consulting point of view the light is either Red or Yellow. We’ve never seen a pure Green light but we have perceived some blue tint coming in of late so there may be some Green out there…but we’ll never admit it!

Have a great April and we’ll see you back here in May.

Thanks for reading, and please stay tuned…

Release Site: www.bls.gov


Every effort is made to ensure accuracy of data transcription but accuracy cannot be guaranteed.  The official release site should be cross referenced. The analysis represents the opinion of Blue World Asset Managers, LTD. who does not warrant or guarantee predictions based on its analysis.


©Blue World Asset Managers, LTD Friday, April 06, 2018

Blue World Economic Index® Report for March 2018

Brief Explanation


Blue World Economic Index®

Scale: -2 to +2

Release Date:  Usually the Last or First Business Day of Each Month

Release Site: www.blueworldassetmanagers.com

Management Value: Critical

Date: Tuesday, April 03, 2018


Analysis

The economy is still on the move according to the March 2018 readings. The index advanced led by substantial moves in Employment (no surprise considering the February Jobs Report) and…wait for it…Manufacturing where the advance was entirely from the more objective Non-fed sub-group.

There continue to be some nagging risks, economic and political, out there including, of course, the Fed, lack of inflationary pressure, trade war fears, and – – can’t believe we’re saying this – – porn stars, but the economy appears increasingly resilient in the face of all of it.

The Numbers

The table showing the March numbers is above and we can tell you that April appears off to a strong start. Let’s see if it holds!

The Blue World Jobs Report Analysis will be out Friday morning. See you there!


Every effort is made to ensure accuracy of data transcription but accuracy cannot be guaranteed.  The official release sites should be cross referenced.  The index assignments represent the opinion of Blue World Asset Managers, Ltd. who does not warrant or guarantee predictions based on the index.

©Blue World Asset Managers, LTD Tuesday, April 03, 2018

Blue World Jobs Report Analysis March 9, 2018

Blue World Employment Situation Report Analysis

Release Date: Usually on the first Friday of the month

Release Site: www.bls.gov

Market Impact: Usually Very High

Management Value: Critical

Date: Friday, March 09, 2018

Brain Surgery is not Rocket Science to a Brain Surgeon©


BRACE YOUSELVES…

WE CAN’T FIND ANYTHING “WRONG” WITH IT!!!

And you know we try! So often is the case that the headlines are contradicted by the detail the deeper we push into the weeds. This works in both directions and for any report, not just jobs. This report has a couple of “weaker” spots but no “weak” ones. We’ll start with those.

Overall, Weekly Hours Worked and Wages were essentially up-less-than-expected to flat as was the number of Unemployed. That’s it.

The Participation Rate bridges the gap between “weak” and “strong” by straddling the line, in as much as 63% is still unacceptably low, but it moved .3% to the North in a single month. You may recall we were horrified the last time it moved that much from one report to the next. We called it virtually unprecedented, and it moved the wrong way. Not this time!

The headlines screamed 313k of which 287k came from the Private Sector. That, plus upward revisions to December 2017 and January 2018 of +54k, brings the 2018 monthly average to the mid-200’s.  The Labor Force grew by an impressive and refreshing 806k. Total Employed grew by 785k, and the Not in Labor Force tally fell by a fabulous 653k. That’s huge. The Diffusion indexes for the Total Private Sector and Manufacturing are massive and flirting with 70. For reference, we saw 30s not so long ago.

Now, let’s get back to hours and wages. There is concern from the “experts” out there this morning that there is still no sign of wage pressure. Au contraire! I guess they just don’t know their way around the deep weeds like we do… Review Table B-3 of the Report. Average Hourly Earnings for All Employees M/M and Y/Y were up .1% and 2.5%, respectively. Both were below most consensus estimates. BUT, Average Weekly Earnings were up 3.1% Y/Y so salaried employees seem to be on the move so Hourly will follow if this holds. Even more important, compensation in the Construction industry came in at Y/Y increases of 3.5% and 4% for Hourly and Weekly, respectively. In our relative world of the past ten years, those are pretty good numbers. The work week for all employees remained range-bound but Weekly Hours in Manufacturing jumped from 41.2 hours to 41.5 hours. That is the highest reading since before 2011 (Chart) and Overtime in Manufacturing hit 3.6 hours. That is only the second time since 2011.

Risks? First and foremost is still the Fed. We don’t want to see rate hikes in anticipation of inflation. We need to see some consistent evidence and inter-report confirmation lest we risk locking up the economic brakes. Second, this report may set unrealistic expectations. A reading of say, 230k in the Private Sector next month may not look so good compared to today’s outsized numbers. Also, beware of revisions. We see them be material time and time again. Today is a great example. Optimism, when supported by trending data, is OK when making strategic business decisions. Euphoria is just plain dangerous!

Matt will be on WBBM’s Noon Business Hour in Chicago at 12:09 CST to break it all down live. That’s AM780 and 105.9FM and the Podcast will post later in the day.

If you missed it, you can review the Blue World Economic Index® for February 2018. We’ll see you back here around the first of April for the next BWEI® Report and the jobs report for March is schedule for release on Friday, April 6th.

Have a great March and may your brackets prove un-bustable!!

Thanks for reading, and please stay tuned…

Release Site: www.bls.gov

Every effort is made to ensure accuracy of data transcription but accuracy cannot be guaranteed.  The official release site should be cross referenced. The analysis represents the opinion of Blue World Asset Managers, LTD. who does not warrant or guarantee predictions based on its analysis.


©Blue World Asset Managers, LTD Friday, March 09, 2018