Blue World Employment Situation Report Analysis
Release Date: Usually the first Friday of each month
Release Site: www.bls.gov
Market Sensitivity: VERY HIGH
Management Value: VERY HIGH
Friday, March 08, 2013
Brain surgery is not rocket science to a brain surgeon©
Not bad. Not great, but not as bad as what we’ve become accustomed to. There are those who will offer politically motivated assessments of this report, and both sides will have ammunition, but no matter who you are, a number like 236 thousand is nothing to poo poo when we haven’t seen anything north of 200k in quite some time.
Big gains were tallied in the goods producing sector with construction leading the way. In the private services sector, information services, retail, business services, temp jobs and, of course, health care added meaningful totals.
While the overall length of the work week remains uninspiring, there was a notable improvement in manufacturing (durable goods) which jumped from 41 to 41.3 hours. In and of itself 41.3 is nothing to write home about, but it does represent a breakout from the recent term pattern.
Wages were also up by respectable amounts in certain areas including weekly construction and manufacturing pay.
The downside…Let’s start here. 7.7% unemployment in the United States of America is simply unacceptable no matter what the current size of the labor force. Yes, the rate is down again this month but that’s because, you guessed it, new hires went up and the labor force got smaller.
Here are the latest charts.

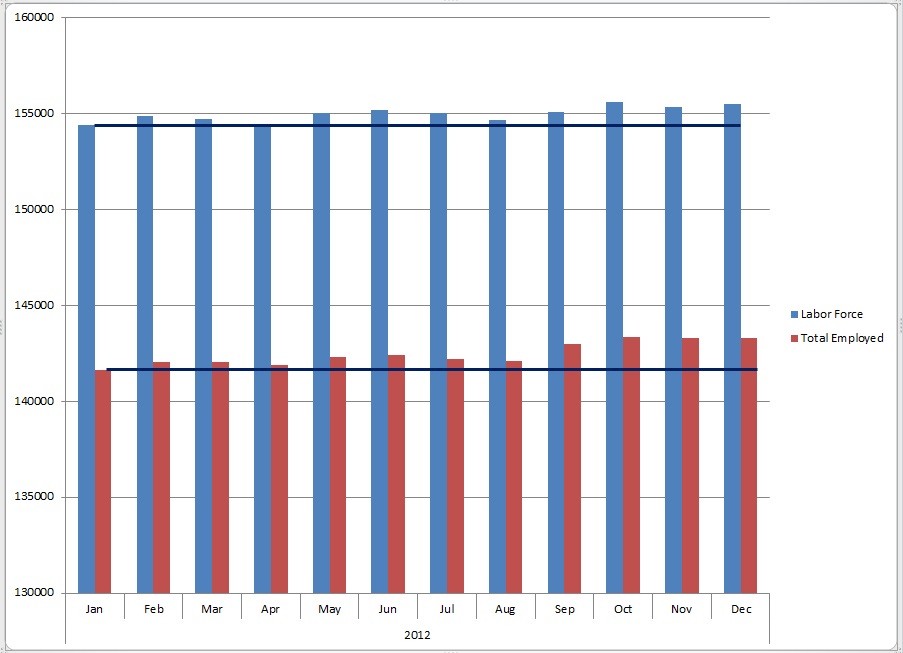
Labor Force vs. Total Employed
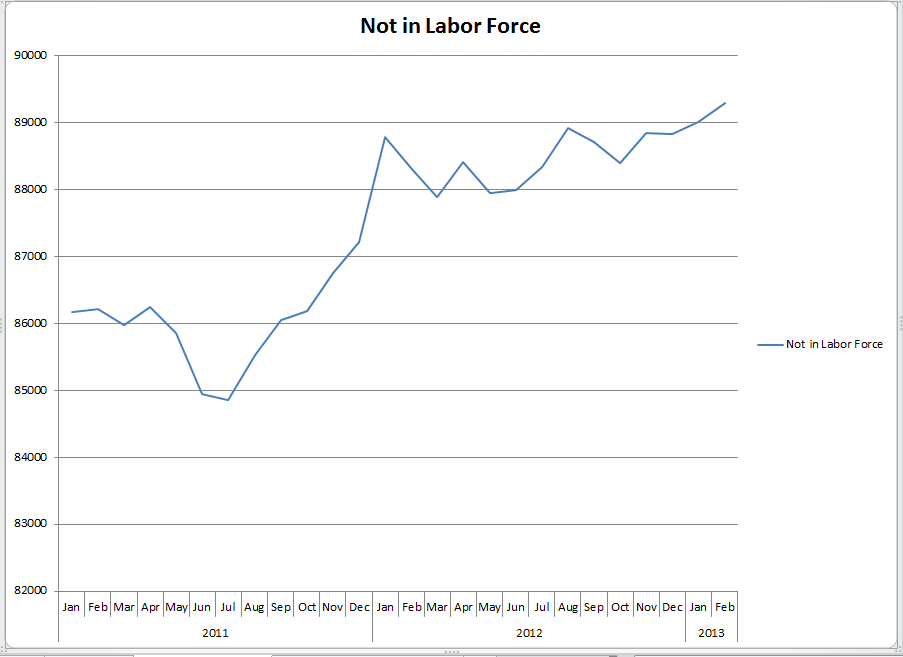
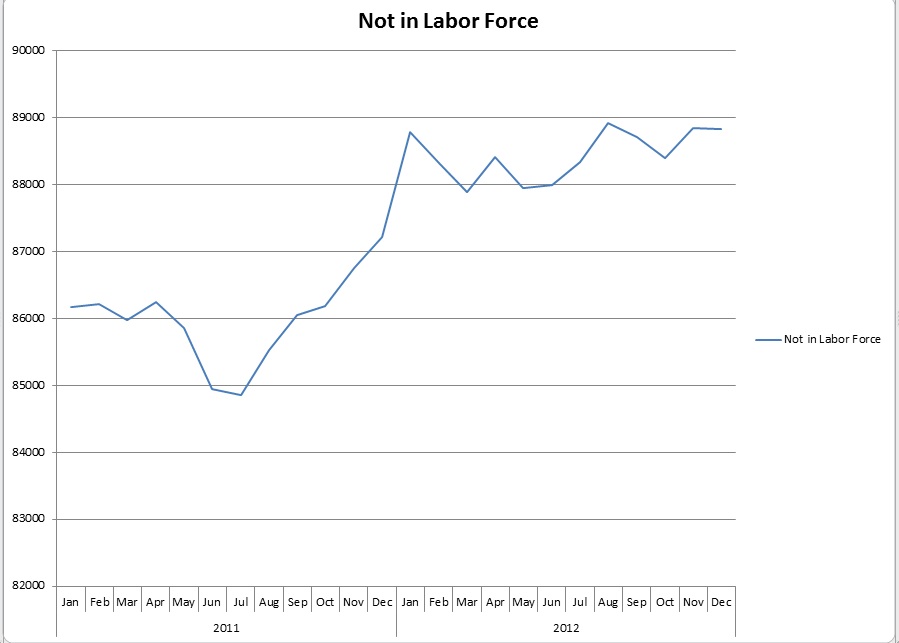
Not in Labor Force
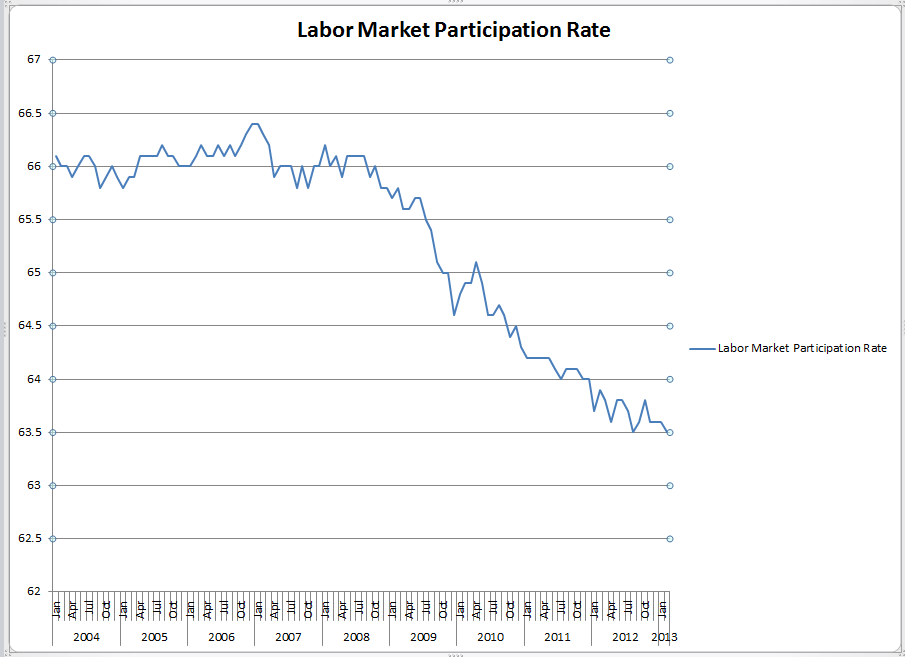
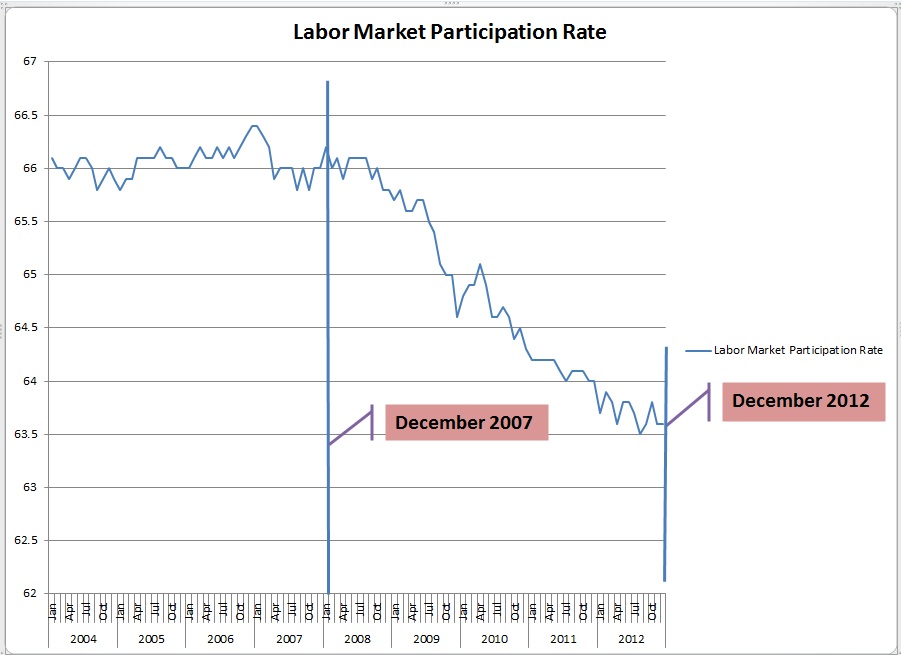
Labor Force Participation Rate
It’s difficult to get too excited about the number of new jobs, even at +200k, and the unemployment rate when we continue to see contractions in the size of the labor force and participation rates. If the labor force were the same size now as it was back in ’08-’09 the unemployment rate would be well above 10%. As we’ve said, we can’t improve the labor market by reducing the number of workers in it.
So, all in all, we would consider this a mixed report. That is a HUGE improvement over what we’ve had to work with for a time period no longer measured in months or even quarters but years! PLEASE remember, no report is meaningful unto itself. The upside in this report only matters if it becomes the beginning of a sustainable trend of improvement. You know we’ve seen this head fake before, so don’t run right out and open the purse strings into a strong tail wind just yet.
BTW: Last month we pointed toward the income and outlays figures as something to watch. The reports were as expected, down. Even with the income improvements seen here the tax bite appears to be overwhelming the increases. Overall this month the total complexion of the economy remains unchanged at mixed, with about as many negative reports as positive and today’s jobs report being one of the brighter spots for a change. Key reports to watch this month will be income and outlays, GDP and productivity, which took a bit hit in February.
Well, it wouldn’t be a Blue World analysis if we didn’t mention the market. Doesn’t its behavior just kill ya? All these lackluster jobs reports headlines with deplorable detail and the market just flies. Today the headlines are a little better, and there are actually some bright spots in the detail yet the market opens ho hum, and as of 9:00a Central time has turned decidedly downward. Go figure.
As always, thanks for reading and please stay tuned…
Release Site: www.bls.gov
Every effort is made to ensure accuracy of data transcription but accuracy cannot be guaranteed. The official release site should be cross referenced. The analysis represents the opinion of Blue World Asset Managers, Ltd. who does not warrant or guarantee predictions based on its analysis.
©Blue World Asset Managers, LTD Friday, March 08, 2013