Key Labor Market Metrics 2011 – 2014

Here are the key metric graphs reflecting the annual data with revisions and including the full years of 2011 – 2014.  Revisions were minor and did not alter any of the poor short or long term trends reflected.

Starting at top, left we have the size of the labor charted against the total number of those employed.  We can see as the lines converge the unemployment rate calculation will become smaller even though there is no improvement in the labor force.  This point is validated moving to the right and then below, left showing the participation rate and the number of those no longer in the labor force.  The fact that the graph showing those no longer in the force is rising faster than the total employed line is very unsettling and not recovery-esque. Finally at below, right we see the length of the work week showing a very narrow average over the period.


Graphs - 2011-2015


Blue World Jobs Report Analysis 01-09-2015

Blue World Employment Situation Report Analysis

Release Date:  Usually the first Friday of each month

Release Site: www.bls.gov

Market Sensitivity: VERY HIGH

Management Value: VERY HIGH

Friday, January 09, 2015

Brain surgery is not rocket science to a brain surgeon©

Image: John Boehner


Do you hear us, AND ARE YOU LISTENING?!? 

Happy New Year everyone!  We hope the Christmas season was safe and joyous.  Now, back to business.  The jobs report is out and we’ll comment on it as usual but we will also offer a bit broader overview of how the economy fared in general for the period of 2011 – 2014.  We think you’ll find it rather sobering as we did.

First, the jobs report.  Same ‘ole theme of a decent number of new jobs with the private sector breakout sporting a little less luster than the headline number, which came in at 252k, 12k more than the private sector total.  The labor force shrank by another quarter million plus so, as has been the pattern, the number of those employed grew at a faster rate, further enhancing the irrelevance of the unemployment rate calculation.  The “Not in Labor Force” tally swelled by another half million driving the Participation Rate to equal its “recovery” record low.  There were corresponding spikes in the “Marginally Attached” and “Discouraged Workers” yielding a true unemployment rate just north of 11% which is, of course, also optimistic for the same reasons as the headline number.  Wages across the board, and notably in construction and manufacturing, took a noticeable hit with some downward revisions to previous periods.  The work-week length remained stagnant, BUT there may be a brightening spot.  The overtime hours in manufacturing has demonstrated small but nevertheless consistent increases for the 4th quarter.  Let’s hope that holds.

Annual revisions to the prior data will be showing up beginning next month so graphs may look a little hinky as they can at each New Year, but the patterns will be valid.  Here are some sobering statistics.

Percent Change for the period:

2013-2014 2011-2014
Labor Force 0.32% 1.45%
Total Employed 1.64% 4.38%
Participation Rate -0.61% -2.00%

This shows quite clearly why we say the unemployment rate as published has lost all credibility and value as a proxy for the health of the labor market and economy at large.

Speaking of the economy at large, well, it’s not declining, but it’s not advancing either.  Blue World tracks over 40 reports per month from both private and public sources in the following 8 categories:

General measures (i.e. GDP)

Consumer mood and activity

Employment

Inflation

Manufacturing

Residential Reals Estate

Retail Performance

Services Sector

Of those, in 2014 five categories were in mild positive territory as analyzed internally at Blue World, and three were slightly negative.  All told, this is still an economy waiting for a direction.  We have repeated the sentiment that policy matters, and it is no secret that we have been very critical of the ones in place.  We don’t care what works, just that it works…and these don’t.  We voters expressed a desire for policy change, and our new hires will take office this month.  Let’s pray they’re listening.

Thanks for reading and, please, stay tuned…

Release Site: www.bls.gov

Every effort is made to ensure accuracy of data transcription but accuracy cannot be guaranteed.  The official release site should be cross referenced.  The analysis represents the opinion of Blue World Asset Managers, Ltd. who does not warrant or guarantee predictions based on its analysis.

©Blue World Asset Managers, LTD Friday, January 09, 2015


Blue World Jobs Report Analysis 12-05-2014

Blue World Employment Situation Report Analysis

Release Date:  Usually the first Friday of each month

Release Site: www.bls.gov

Market Sensitivity: VERY HIGH

Management Value: VERY HIGH

Friday, December 05, 2014

Brain surgery is not rocket science to a brain surgeon©

Whoa!  321k!!  Folks, that number by any standard is a solid number.  The total we care about is the private sector tally, and even that is a very respectable 314k, net of the 7k new government jobs.  Is there still some hair on the good news?  Yes, but let’s take a rare moment in recent jobs report history and say November 2014 was a good month for net new job growth.  I wish we could end it there, but we are obligated to share the caveats and cautions, so here we go…

The fuzzy math continues to play havoc with the unemployment rate, which didn’t move in spite of the best job growth in a long time.  That phenomenon is validated by an unchanged participation rate still languishing in record low territory at 62.8%.  Why?  Because even though we had 300k+ new jobs, we also grew the unemployed number by 115k and added 69k to the line item total for “Not in the Labor Force.” In fact, the total of those reporting themselves as “Employed” only grew by 4K.  Those unemployed between 1 and 26 weeks grew by a worrisome 148k, and the diffusion index in manufacturing, while still well above 50, fell by 1.2%.  Wages continue just barely pacing inflation having grown just 2% since November 2013.

25 College History 12-14

As our regular readers know, one of our “go to” metrics when assessing the true health of the labor market is the unemployment rate among those who are at least 25 years old and have a minimum of a four year college degree.  Due to their educational attainment bolstered by real world experience, this group has historically been the most bulletproof when it comes to weaker economies and unemployment.  That has, unfortunately, not been the case of late so we wanted to share some perspective on how this reflects the poor economy.  As of November 2014 the average unemployment rate for this group is 2.8% since the statistic has been recorded.  Prior to 2008 the average unemployment rate for this group was only 2.4%.  Since January of 2008 the average is 3.9%.  Furthermore, this group had never gone more than 13 consecutive months unemployed at a rate of 3% or more, with a record high of 3.4%.  They have now spent six consecutive years unemployed over 3% with a record high above 5%.

Coincidence?  We think not.  Policy matters.

321k is exciting…as long as it becomes the first step in a series of improvements and not just a blip.  Let’s hope some meaningful policy course changes are in the works that can render this the first step in establishing a true and sustainable recovery.

Thanks for reading and, please, stay tuned…

Release Site: www.bls.gov 

Every effort is made to ensure accuracy of data transcription but accuracy cannot be guaranteed.  The official release site should be cross referenced.  The analysis represents the opinion of Blue World Asset Managers, Ltd. who does not warrant or guarantee predictions based on its analysis.

©Blue World Asset Managers, LTD Friday, December 05, 2014

Blue World Jobs Report Analysis 11-07-2014

Blue World Employment Situation Report Analysis

Release Date:  Usually the first Friday of each month

Release Site: www.bls.gov

Market Sensitivity: VERY HIGH

Management Value: EVEN HIGHER

Friday, November 07, 2014

Brain surgery is not rocket science to a brain surgeon©

What can we tell you?  Same ole’, same ‘ole…but we are not blind to the fact that that, in and of itself, it is a slight improvement even if for just one month.  We have had many reports over the last several years that were of the copy-and-paste sort, and then we’ve had those that fell well short of copy-and-paste by virtue of the detail exposing the truth about how bad it was in spite of the headline numbers.  That might cause copy-and-paste to become a bit of a relief.  But let’s be honest, this is not a “good” report, the labor market is not improving, and this is not a “recovery.”

The headline says 214k new hires, but the number we care about, the private sector, only added 206k.  Last month we pointed out the Not in Labor Force number was growing faster than the number of new jobs created each month.  Some of our “expert” critics are already elbowing us (electronically) this morning about the 206k drop in that stat.  Ya know how we keep sayin’ trends and comparisons matter a lot more than data points?  Maybe we can teach those “experts” something here.  True, the number did drop by 206k, but in spite of that there are still 622k more than there were in October of 2013!!  We know our readers get it, but the experts need pictures so we’ll put in the graph later.  For now, here is some perspective.

  • The number of Employed Persons is 147,283M
  • The number of persons Not in the Labor Force is 92,378M
  • Since January of 2011 the Labor Force has grown by 2%
  • Since January of 2011 the number of Employed has grown by 6%
  • Since January of 2011 the number of persons Not in the Labor Force has grown by 7%

The 2% growth in the labor force vs. the 6% growth in employed people further illustrates why the unemployment rate, as published, is invalid as an economic metric, as well as both being pathetic for a three year period in the United States of America economy!.  The work week and manufacturing overtime remain flat, the participation rate is still languishing in record low territory, those unemployed with a Bachelor’s degree or higher ticked up, and meaningful wage growth remains absent.  Here’s that Not in the Labor Force graph with the labor force vs employed thrown in for good measure.

NILF for 11-7-14 PostFvE for 11-7-14

Maybe a cubicle-based “expert” can look at 92 million Americans (or whatever) out of work and see a “recovery,” but for those of us insophisticates who just own or manage businesses, invest real money, employ real people and make decisions that actually affect the economy, well, let’s just say “we don’t see a recovery.”

How many times can we say it; policy matters and these aren’t working.  Do we have some optimism that the election results from 11/04/2014 can lead to some more effective policies?  Yes, but remember, Washington is full of “EXPERTS!”


Thanks for reading and, please, stay tuned…

Release Site: www.bls.gov

Every effort is made to ensure accuracy of data transcription but accuracy cannot be guaranteed.  The official release site should be cross referenced.  The analysis represents the opinion of Blue World Asset Managers, Ltd. who does not warrant or guarantee predictions based on its analysis.

©Blue World Asset Managers, LTD Friday, November 07, 2014

Employment Situation Report Analysis 10-03-2014

Blue World Employment Situation Report Analysis

Release Date:  Usually the first Friday of each month

Release Site: www.bls.gov

Market Sensitivity: VERY HIGH

Management Value: VERY HIGH

Friday, October 03, 2014

Brain surgery is not rocket science to a brain surgeon©

Records were made to be broken, but as we all know some records are the last ones you want to be the one to break. 

play_a_prairieviewplayers_576_crop_north


Source: espn.go.com from an article in Bleacher Report at http://bleacherreport.com/multiple-sports

As the “expert” world cheers, Blue World cries FOUL!!”

80 consecutive losses as a football team may be an embarrassing record to hold, but the record this administration broke in September 2014 is far worse than just embarrassing!

Wow!  This report is worse than last month’s, but it will be hard to break through the manic headlines to find the truth!

Occasionally we’ll need to remind readers that the jobs report number has been politicized.  Here’s a Forbes article that echoes Blue World’s analysis following a new BLS chief appointment and a fraudulent drop in unemployment to below 8% just before the 2012 election.  Cynical?  Absolutely, but not in this case.  The mathematical proof is in the BLS pudding.  Fewer jobs equals an improved unemployment rate, and more jobs has yielded a deterioration in the rate?  Not to mention that the number of new jobs published in those situations could NEVER cause an honest rate calculation to move that much.  How do they do it?  There are lots of tricks they can used to “cook” the headline numbers, but the truth is still hiding in the weeds.  Why is the truth allowed to survive in there?  We suspect it’s not because they can’t fudge the details.  We think it’s just because they figure so few pay attention to them that it doesn’t matter.  Unfortunately, they’re correct.   That’s why you, the astute manager and investor, follow us to know what’s really going on.  As Matt said on CBS Radio last month, the unemployment rate has lost all credibility as a proxy for the health of the labor market.  Here’s a link to the of that show.  This month is no less a fraud on the managing, investing and voting public.  Let’s look at why that’s true…

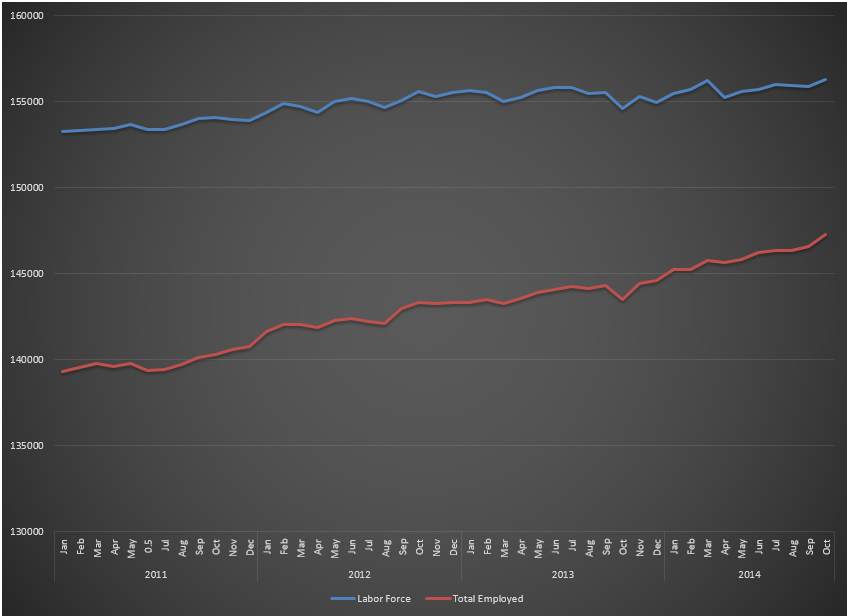
248k new jobs.  Great!  Of those, however, only 236k are in the private sector which keeps us well below our 250k requirement to just break even on those becoming eligible to work each month.  The labor force lost almost 100k more members in September 2014 and those not in the labor force swelled by 315k.  Yes, 315k.  So, 236k new jobs…and 315k left the labor force.  See the fraud yet?

The work week remained range bound at just 34.6 hours but construction hours fell by .2 hours.  That’s big.  It’s also the second worst showing of 2014.  Hourly wages actually declined.

Without fully detailing a diffusion index, we’ll just say here that readings over 50 point to expansion and those under 50 show contraction.  Consider the uncomfortable three-month trend in the manufacturing sector’s diffusion index starting in July: 56.2, 54.9, and 51.9.  That’s not pretty.

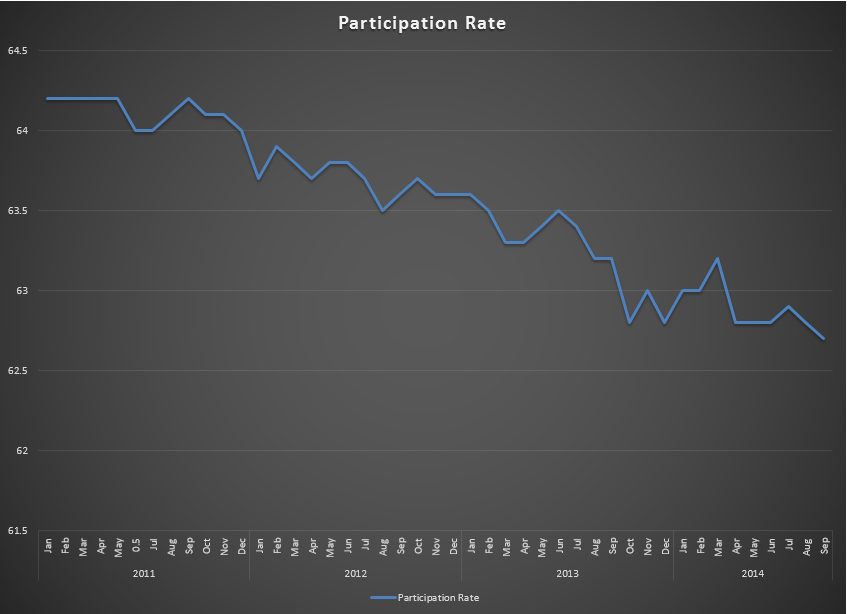
All that would be bad enough, but there is one glaring statistic that you will see here and from very few other responsible analysts…the participation rate.  Ladies and gentleman, the available, eligible labor force for the United States of America has set a NEW RECOVERY RECORD LOW PARTICIPATION RATE in September of 2014!  For those of you keeping score, that’s 5 years, 3 months into a “RECOVERY!”  The participation rate has fallen to 62.7%, a level not seen since 1978.  The sad chart is included below.

9-14 Part Rate

We say ignorance is curable but stupid is forever.  So let’s leave ignorance out of the equation and focus on stupid, then ask what’s worse; stupid or dishonest?  We say “stupid AND dishonest!”  The participation rate is low because baby boomers have done so well that they can afford to retire early especially since they have access to affordable healthcare under Obamacare?!!?  We’re not kidding!  You have to go and read the comments under this article from Business Insider.  It is UNBELIEVABLE!  Sometimes calling someone “stupid” is an insult…to stupid people.

Business owners, managers and investors everywhere need to be aware of the realities of this economy.  Our governmental leaders are out there telling us the economy is fine and improving.  They tell us their policies are working and we are just too ignorant to see it.  Believing this rhetoric is nothing short of dangerous to our economic health!

So, as always, thanks for reading, keep the defense on the field, and for management and investment sake please, stay tuned…

Release Site: www.bls.gov

Every effort is made to ensure accuracy of data transcription but accuracy cannot be guaranteed.  The official release site should be cross referenced.  The analysis represents the opinion of Blue World Asset Managers, Ltd. who does not warrant or guarantee predictions based on its analysis.

©Blue World Asset Managers, LTD Friday, October 03, 2014