Blue World Economic Index® for January 2018

Brief Explanation

Blue World Economic Index®

Scale: -2 to +2

Release Date:  Usually the Last or First Business Day of Each Month

Release Site: www.blueworldassetmanagers.com

Management Value: Critical

Date: January 31, 2018


Analysis

What else can be said? The economy is on the move. The BWEI® made a material move to the North this month, and much of that was based on quarterly reviews of the twelve and twenty-four month trends which are more heavily weighted when calculating the index value. An upgrade of the ADP 1-year trend from -.5 to .5 was particularly impactful.  Within the Consumer Major Category, the TD Ameritrade IMX demanded trend upgrades as did Investor Confidence, while the Bloomberg Consumer Comfort Index set a monthly average record high.

We continue to feel the momentum is real but fragile and subject to political, economic, and policy risk, not the least of which is an apparent bias toward prophylactic rate increases in anticipation of inflation. The Hawks need to stand down for a while and let this thing develop. Uncertainty about the outcome of investigations is causing hesitancy as the world frets about whether the guy whose policies sparked the move will make it through a full term.

There was a great deal of anticipation regarding the Employment Cost Index report that came out Wednesday morning, but we don’t know why. This is a quarterly report which won’t take the effects of the post-tax reform wage increases into effect until Q2 of 2018. In spite of that, one can hallucinate a slightly positive trend developing already. Matt talked about the impact of tax reform on WBBM’s Noon Business Hour in Chicago on January 11th. You can follow the link, scroll down to the 11th and Matt starts at 2:20 into the podcast. 

The Numbers

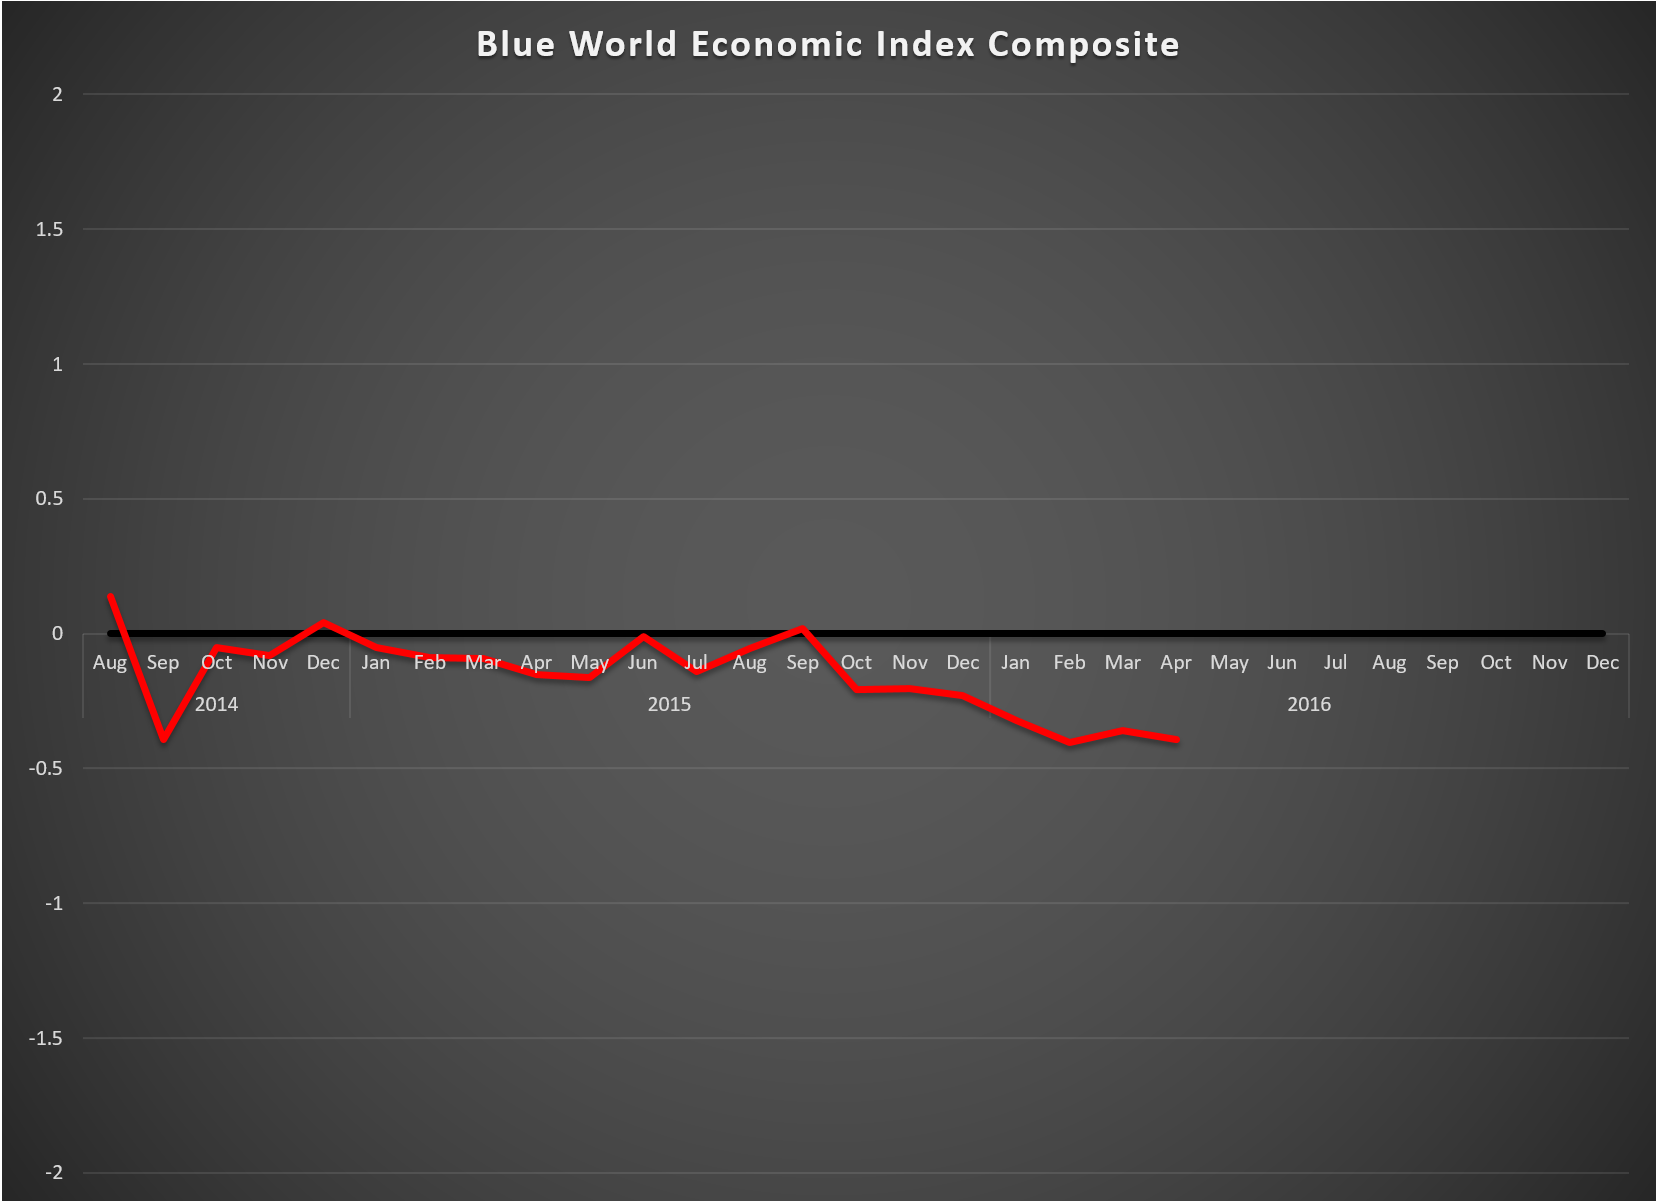
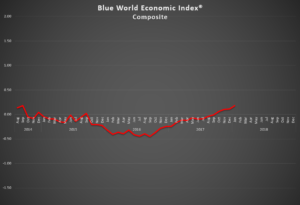
The index advanced .06 to .18 (rounded) from .11. That ties the all-time record high set in September of 2014.

Employment, Inflation and Services remain painted in red ink where Employment showed material improvement, Inflation retreated fractionally, and Services were still stubbornly unchanged. Consumer, General Measures, Manufacturing, Retail, and Real Estate are positive where all padded their leads except Manufacturing and Retail, which showed fractional slips. The Manufacturing pullback was actually welcome as the Fed sub-group surveys came back down to solid yet sustainable levels of strength.

ADP was huge Wednesday morning. Let’s see if it translates to the BLS out this Friday the 2nd of February. The Blue World Jobs Report Analysis will be out before noon Friday. See you there and have a great month!


Every effort is made to ensure accuracy of data transcription but accuracy cannot be guaranteed.  The official release sites should be cross referenced.  The index assignments represent the opinion of Blue World Asset Managers, Ltd. who does not warrant or guarantee predictions based on the index.

©Blue World Asset Managers, LTD Wednesday, January 31, 2018

Blue World Economic Index® for February 2017

Brief Explanation


Blue World Economic Index®

Scale: -2 to +2

Release Date:  Usually the Last or First Business Day of Each Month

Release Site: www.blueworldassetmanagers.com

Management Value: Critical


Tuesday, February 28, 2017


Feb 17 Graph


The index is on the move…but still betting on the come! Overall, the composite improved by .08, moving from -.25 to -.16, a healthy jump. Six of the eight major categories are still running in the negative, but six of the eight also improved in February.

From a hundred thousand feet conditions appear to be improving, but the charge is clearly being led by the surveys of anticipation as opposed to the hard data. Is that ok? Of course! As we’ve said, no optimism, no recovery. But the delta is rather striking and nowhere more than in Manufacturing. That category follows twelve reports each month. Six of them make up the Regional Fed Manufacturing Districts sub-group survey reports. The hard manufacturing data actually slipped in February, but the Fed sub-group jumped by .17 to post a +.2! That says managers are optimistic that things are going to pick up rather quickly. Let’s hope it develops that way.

Policy matters, and in fact, anticipation of policy matters. The prospective changes that are being advertised have the general business community and the consumer in a very giddy mood, but we caution it is still just a good mood driven by optimism, so be excited, but don’t bet the farm until the hard data establishes a verifiable trend. The way it’s looking, we still believe that could show early signs before year end.

The Employment Situation Report is scheduled for release on Friday, March 10.  That may delay The Blue World Jobs Report Analysis until Monday the 13th, but if that’s the case it will incorporate the Labor Market Conditions Index analysis so there will be a little more meat on the bone.


Have a great month!


Every effort is made to ensure accuracy of data transcription but accuracy cannot be guaranteed.  The official release sites should be cross referenced.  The index assignments represent the opinion of Blue World Asset Managers, Ltd. who does not warrant or guarantee predictions based on the index.

©Blue World Asset Managers, LTD Tuesday, February 28, 2017

Blue World Jobs Report Analysis 02/03/2017

Blue World Employment Situation Report Analysis

Release Date: Usually on the first Friday of the month

Release Site: www.bls.gov

Market Impact: Usually Very High

Management Value: Critical


Friday, February 03, 2017

Brain Surgery is not Rocket Science to a Brain Surgeon©


Kramden Basic


OOHHH, WHAT A SURPRISE!


… but not for the reasons the “experts” think. We’ll explain.


This White House seems to be working fast, but nobody’s that fast. In other words, don’t look for this to anchor a gigantic new trend quite yet. The real surprises for those who invest real money, manage real businesses, and employ real people are in the details. We’ll point them out.

To start, the total Unemployed grew by more than the total Labor Force, but both were positive numbers and widened the spread, so the Unemployment Rate (who cares) ticked up and that was a good sign in this case. As we’ve said, the Unemployment Rate is no longer a reliable proxy for the actual health of the Labor Market. The Participation Rate ticked up .2% to 62.9%. That is still horrible, BUT… that stat usually moves .1% at a time. When we’ve seen bigger moves they have typically been in the wrong direction, so a .2% move to the North is a welcome departure.

The real surprises? OK. We always point out the headline number is never the one we care about because it includes both Private Sector and Government hires. We only care about the Private Sector when analyzing the economy, and we have been accustomed to writing about the Private Sector totals being lower that than the headline tally. If you’re new to this report or just missed last month, we describe this in some detail here. The three-month revisions to the Private Sector numbers netted us plus 1k jobs. The Private Sector net total for January was 237k, 10k higher than the 227k headline, because the Government shrank its workforce by 10k. That’s before the hiring freeze was completely in effect. Another surprise was the accuracy of the ADP report. Their number was only 9k off of today’s BLS. Believe us, that is a surprise. The counting methods of the two reports are so different that the ADP report usually gives a hint of direction but not such tight agreement in totals. The really big news, however, is with regard to the Not in Labor Force totals. For the last two months we have been over the 95M mark, and that is staggering. Remember, these people are not counted as “unemployed” in calculating the Unemployment Rate because they have not looked for work recently. This is why we hear people talk about the true unemployment rate, which is still double digit, if we include the NILF in the unemployed count. That number fell by three-quarters of a million people last month! We don’t recall that kind of a drop in a single month. That number is confirmatory of several important indicators. First, it validates the big jump in the Participation Rate as non-participants are re-entering the labor market. Why? Because, suddenly, they have renewed optimism that jobs will be available. This is also confirmatory of the Consumer and business outlook metrics followed by the Blue World Economic Index®, all of which cite positive outlooks by consumers to find work and businesses to offer work.

No positive change was ever precipitated by pessimism, as demonstrated in the last eight years. We do not make political statements through these reports. We don’t care what works, as long as it works. And by “works” we mean policy creates an environment conducive to economic expansion through private sector enterprise growth. Period.

All that said, don’t get crazy. This is just one report, a single data point. Unto itself it means virtually nothing. Policy needs to be implemented as advertised, have a chance to bear fruit, and adjustments made if needed. That takes time. We estimate Q3 before we have the earliest pattern indications of what this will all mean so hang in there and we’ll see you back here at month’s end for the Blue World Economic Index® report.


Thanks for reading, and please stay tuned…


Release Site: www.bls.gov


Every effort is made to ensure accuracy of data transcription but accuracy cannot be guaranteed.  The official release site should be cross referenced. The analysis represents the opinion of Blue World Asset Managers, LTD. who does not warrant or guarantee predictions based on its analysis. 
©Blue World Asset Managers, LTD Friday, February 03, 2017

Blue World Economic Index® for November 2016

Brief Explanation


Blue World Economic Index®

Scale: -2 to +2

Release Date:  Usually the first Business Day of Each Month

Release Site: www.blueworldassetmanagers.com

Management Value: Critical


Thursday, December 01, 2016

11-nov-2016


The Blue World Economic Index® showed material improvement for the November 2016 report while still landing solidly in negative territory at -.28. Yes, much of the reporting posted after the election, but we need to remember that most of the data was actually collected well in advance. The December report will give a much clearer picture of whether the economy is following the public markets, whose momentum will be closely watched. The weekly data, however, was more indicative of post-election reaction particularly in the Consumer category, via the Bloomberg Consumer Comfort report, whose northerly movement in the second two thirds of the month was unmistakable, yielding an average of 42.2 in October and 45 for November. While the markets made their moves, the data suggests it was more on the backs of retail traders (TD Ameritrade IMX), as institutional investors (State Street Investor Confidence) were more cautiously contemplating the combined implications of Brexit, POTUS, and further EU escape rumblings in places like Germany and Italy.

Of the eight major categories, six were still negative, but there was notable improvement in five including Consumer, Employment, General, Retail, and Manufacturing which included a bump to the Fed sub-group.

We end most of our reports by pointing out that policy matters…and these aren’t working. We firmly believe there is no sin in being wrong. The sin is committed when we refuse to recognize we were wrong and fail to change policy in response. We think it is safe to say…we’re about to get a look at the effects of some VERY different policy!


Every effort is made to ensure accuracy of data transcription but accuracy cannot be guaranteed.  The official release sites should be cross referenced.  The index assignments represent the opinion of Blue World Asset Managers, Ltd. who does not warrant or guarantee predictions based on the index.
©Blue World Asset Managers, LTD Thursday, December 01, 2016

Blue World Economic Index® for April 2016

Brief Explanation

Blue World Economic Index®

Scale: -2 to +2

Release Date:  Usually the Last or First Business Day of Each Month

Release Site: www.blueworldassetmanagers.com

Management Value: Critical

Release Site: www.blueworldassetmanagers.com

Friday, April 29, 2016

BWEI Graph 4-16


April started out with a little optimism as reporting from March hinted at some possible momentum, then the Empire State Manufacturing Survey kicked off the Fed district reporting at mid-month with solid positives, but it all went South in a hurry.

The BWEI® tied its lowest reading of -.39 since we started making the index available publicly in August of 2014.

Of the 8 major categories, 3 managed readings above 0 including Consumer Measures, which slipped a substantial .5 from .8 to .3.  Real Estate and Services join Consumer on the plus side of zero, and both showed fractional improvements over March. Employment, General Measures, Inflation, Manufacturing and Retail remain in decidedly negative terrain.

We don’t see the Fed making any big moves based on this data, which should make the markets happy but signal defense to those who manage real businesses and employ real people.

Look for The Blue World Jobs Report Analysis next Friday and have a great week.

Every effort is made to ensure accuracy of data transcription but accuracy cannot be guaranteed.  The official release sites should be cross referenced.  The index assignments represent the opinion of Blue World Asset Managers, Ltd. who does not warrant or guarantee predictions based on the index.
©Blue World Asset Managers, LTD Friday, April 29, 2016