Blue World Jobs Report Analysis 11-07-2014

Blue World Employment Situation Report Analysis

Release Date:  Usually the first Friday of each month

Release Site: www.bls.gov

Market Sensitivity: VERY HIGH

Management Value: EVEN HIGHER

Friday, November 07, 2014

Brain surgery is not rocket science to a brain surgeon©

What can we tell you?  Same ole’, same ‘ole…but we are not blind to the fact that that, in and of itself, it is a slight improvement even if for just one month.  We have had many reports over the last several years that were of the copy-and-paste sort, and then we’ve had those that fell well short of copy-and-paste by virtue of the detail exposing the truth about how bad it was in spite of the headline numbers.  That might cause copy-and-paste to become a bit of a relief.  But let’s be honest, this is not a “good” report, the labor market is not improving, and this is not a “recovery.”

The headline says 214k new hires, but the number we care about, the private sector, only added 206k.  Last month we pointed out the Not in Labor Force number was growing faster than the number of new jobs created each month.  Some of our “expert” critics are already elbowing us (electronically) this morning about the 206k drop in that stat.  Ya know how we keep sayin’ trends and comparisons matter a lot more than data points?  Maybe we can teach those “experts” something here.  True, the number did drop by 206k, but in spite of that there are still 622k more than there were in October of 2013!!  We know our readers get it, but the experts need pictures so we’ll put in the graph later.  For now, here is some perspective.

  • The number of Employed Persons is 147,283M
  • The number of persons Not in the Labor Force is 92,378M
  • Since January of 2011 the Labor Force has grown by 2%
  • Since January of 2011 the number of Employed has grown by 6%
  • Since January of 2011 the number of persons Not in the Labor Force has grown by 7%

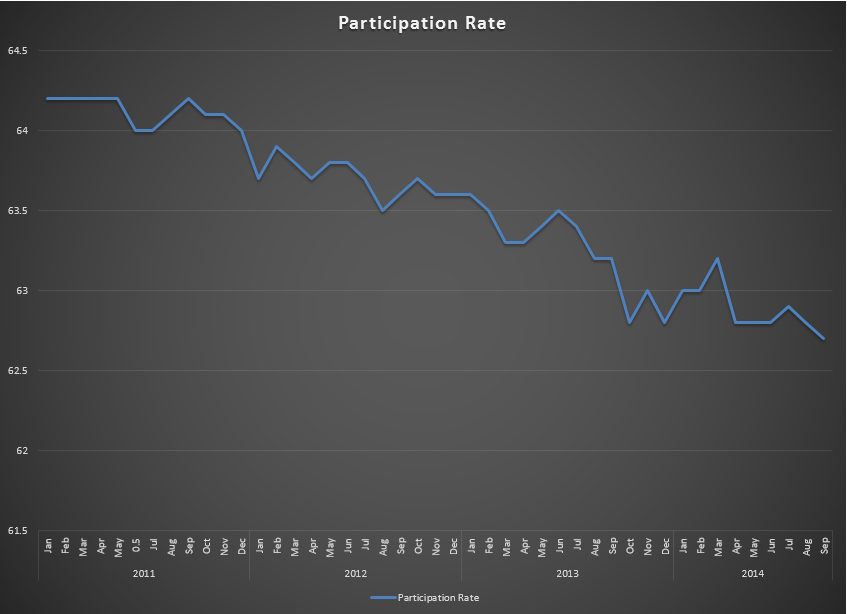
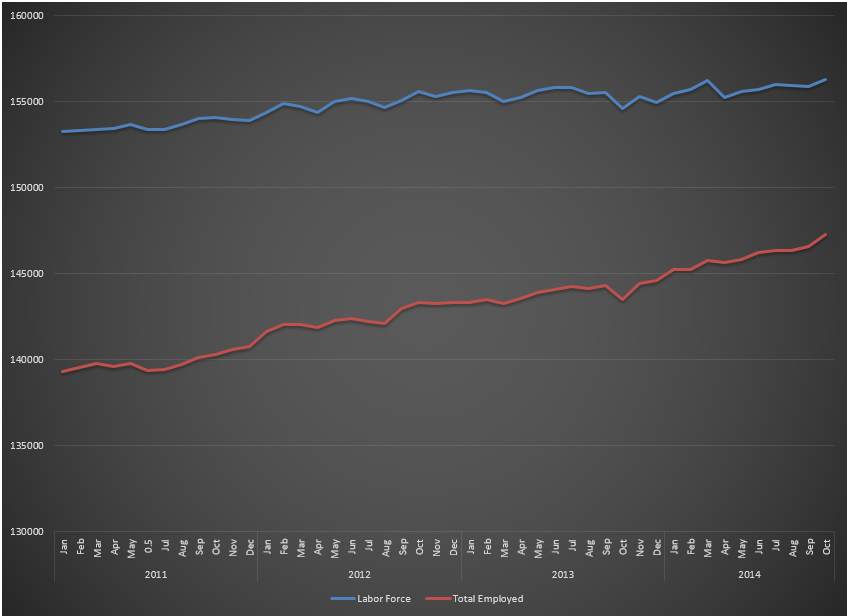
The 2% growth in the labor force vs. the 6% growth in employed people further illustrates why the unemployment rate, as published, is invalid as an economic metric, as well as both being pathetic for a three year period in the United States of America economy!.  The work week and manufacturing overtime remain flat, the participation rate is still languishing in record low territory, those unemployed with a Bachelor’s degree or higher ticked up, and meaningful wage growth remains absent.  Here’s that Not in the Labor Force graph with the labor force vs employed thrown in for good measure.

NILF for 11-7-14 PostFvE for 11-7-14

Maybe a cubicle-based “expert” can look at 92 million Americans (or whatever) out of work and see a “recovery,” but for those of us insophisticates who just own or manage businesses, invest real money, employ real people and make decisions that actually affect the economy, well, let’s just say “we don’t see a recovery.”

How many times can we say it; policy matters and these aren’t working.  Do we have some optimism that the election results from 11/04/2014 can lead to some more effective policies?  Yes, but remember, Washington is full of “EXPERTS!”


Thanks for reading and, please, stay tuned…

Release Site: www.bls.gov

Every effort is made to ensure accuracy of data transcription but accuracy cannot be guaranteed.  The official release site should be cross referenced.  The analysis represents the opinion of Blue World Asset Managers, Ltd. who does not warrant or guarantee predictions based on its analysis.

©Blue World Asset Managers, LTD Friday, November 07, 2014

Employment Situation Report Analysis 10-03-2014

Blue World Employment Situation Report Analysis

Release Date:  Usually the first Friday of each month

Release Site: www.bls.gov

Market Sensitivity: VERY HIGH

Management Value: VERY HIGH

Friday, October 03, 2014

Brain surgery is not rocket science to a brain surgeon©

Records were made to be broken, but as we all know some records are the last ones you want to be the one to break. 

play_a_prairieviewplayers_576_crop_north


Source: espn.go.com from an article in Bleacher Report at http://bleacherreport.com/multiple-sports

As the “expert” world cheers, Blue World cries FOUL!!”

80 consecutive losses as a football team may be an embarrassing record to hold, but the record this administration broke in September 2014 is far worse than just embarrassing!

Wow!  This report is worse than last month’s, but it will be hard to break through the manic headlines to find the truth!

Occasionally we’ll need to remind readers that the jobs report number has been politicized.  Here’s a Forbes article that echoes Blue World’s analysis following a new BLS chief appointment and a fraudulent drop in unemployment to below 8% just before the 2012 election.  Cynical?  Absolutely, but not in this case.  The mathematical proof is in the BLS pudding.  Fewer jobs equals an improved unemployment rate, and more jobs has yielded a deterioration in the rate?  Not to mention that the number of new jobs published in those situations could NEVER cause an honest rate calculation to move that much.  How do they do it?  There are lots of tricks they can used to “cook” the headline numbers, but the truth is still hiding in the weeds.  Why is the truth allowed to survive in there?  We suspect it’s not because they can’t fudge the details.  We think it’s just because they figure so few pay attention to them that it doesn’t matter.  Unfortunately, they’re correct.   That’s why you, the astute manager and investor, follow us to know what’s really going on.  As Matt said on CBS Radio last month, the unemployment rate has lost all credibility as a proxy for the health of the labor market.  Here’s a link to the of that show.  This month is no less a fraud on the managing, investing and voting public.  Let’s look at why that’s true…

248k new jobs.  Great!  Of those, however, only 236k are in the private sector which keeps us well below our 250k requirement to just break even on those becoming eligible to work each month.  The labor force lost almost 100k more members in September 2014 and those not in the labor force swelled by 315k.  Yes, 315k.  So, 236k new jobs…and 315k left the labor force.  See the fraud yet?

The work week remained range bound at just 34.6 hours but construction hours fell by .2 hours.  That’s big.  It’s also the second worst showing of 2014.  Hourly wages actually declined.

Without fully detailing a diffusion index, we’ll just say here that readings over 50 point to expansion and those under 50 show contraction.  Consider the uncomfortable three-month trend in the manufacturing sector’s diffusion index starting in July: 56.2, 54.9, and 51.9.  That’s not pretty.

All that would be bad enough, but there is one glaring statistic that you will see here and from very few other responsible analysts…the participation rate.  Ladies and gentleman, the available, eligible labor force for the United States of America has set a NEW RECOVERY RECORD LOW PARTICIPATION RATE in September of 2014!  For those of you keeping score, that’s 5 years, 3 months into a “RECOVERY!”  The participation rate has fallen to 62.7%, a level not seen since 1978.  The sad chart is included below.

9-14 Part Rate

We say ignorance is curable but stupid is forever.  So let’s leave ignorance out of the equation and focus on stupid, then ask what’s worse; stupid or dishonest?  We say “stupid AND dishonest!”  The participation rate is low because baby boomers have done so well that they can afford to retire early especially since they have access to affordable healthcare under Obamacare?!!?  We’re not kidding!  You have to go and read the comments under this article from Business Insider.  It is UNBELIEVABLE!  Sometimes calling someone “stupid” is an insult…to stupid people.

Business owners, managers and investors everywhere need to be aware of the realities of this economy.  Our governmental leaders are out there telling us the economy is fine and improving.  They tell us their policies are working and we are just too ignorant to see it.  Believing this rhetoric is nothing short of dangerous to our economic health!

So, as always, thanks for reading, keep the defense on the field, and for management and investment sake please, stay tuned…

Release Site: www.bls.gov

Every effort is made to ensure accuracy of data transcription but accuracy cannot be guaranteed.  The official release site should be cross referenced.  The analysis represents the opinion of Blue World Asset Managers, Ltd. who does not warrant or guarantee predictions based on its analysis.

©Blue World Asset Managers, LTD Friday, October 03, 2014

Blue World Jobs Report Analysis 8-1-2014

Blue World Employment Situation Report Analysis

Release Date:  Usually the first Friday of each month

Release Site: www.bls.gov

Market Sensitivity: VERY HIGH

Management Value: VERY HIGH

Friday, August 01, 2014

Brain surgery is not rocket science to a brain surgeon©

We are sending this postcard to the Experts who are cheering the last 2 month’s reports.

Earth Post Card for 8-1-14


Yep, another world beater! 

We took July 4th off and didn’t post a report.  We wrote it for the sake of data, but we figured if we didn’t feel like reading it on the 4th of July, you wouldn’t either.  Unfortunately one could read the June post and/or this one and not have missed a thing.  This is starting to feel like a soap opera in that once we know the characters we can step away for months, watch one episode and be completely back up to speed.

Will the markets like it?  Who knows (or cares)?  There has been a fundamental shift in market behavior away from economic fundamentals to a focus on government action; so who cares how they take it?  We’re concerned with providing actionable intelligence to the small and mid-sized businesses out there who provide the engine for our nation’s economic growth.  In other words, we care about reality in the real world …you know…as opposed to Planet Cubicle where the experts live, work, and analyze data!  What does the real world think of this report?  The real world knows it remains terrible. 

Now that the qualitative pre-amble is over, let’s quantify “terrible.”

Last month’s 298k was actually 270k when we subtract the additions to government payrolls.  That 270 would still be a respectable number early in a recovery!  The unemployment rate decrease last month was our usual phenomenon of the labor force line and unemployed line moving in opposite directions.  That’s how we continue to claim the headline rate as reported is bogus and that position is validated by a participation rate graph that continues to make lower highs and lower lows.

Those things remain true for July.  There were only 198k new jobs once we net the private sector with government hires.  But guess what?!!  The number of those unemployed also grew by…wait for it…197k!  The rate ticked up by a tenth, but again, who cares about the rate anymore, especially as the participation rate remains in all-time record low territory at 62.9%.  25+ with a B.A. or better are STILL unemployed at rates over 3%.  The Not In Labor Force row from table A tells us there are 92M Americans who didn’t even look for work in the past month.  That number is a staggering 2M more than there were a year ago.  There were big increases in the number of those out of work for 1 to 14 weeks.  In fact, that number alone nearly eclipses the total of new hires for the month.  The length of the work week for all employees has not changed in three months while manufacturing hours and overtime both fell posting their worst numbers in the same time period.

Wages?  Meh.

So, to all our experts out there who exclaimed “yippee” on the BLS release dates for June and July of 2014, wish you were here!

Thanks for reading and, please, stay tuned…

Release Site: www.bls.gov

Every effort is made to ensure accuracy of data transcription but accuracy cannot be guaranteed.  The official release site should be cross referenced.  The analysis represents the opinion of Blue World Asset Managers, Ltd. who does not warrant or guarantee predictions based on its analysis.

©Blue World Asset Managers, LTD Friday, August 01, 2014

Blue World Jobs Report Analysis 5-2-2014

Blue World Employment Situation Report Analysis

Release Date:  Usually the first Friday of each month

Release Site: www.bls.gov

Market Sensitivity: VERY HIGH

Management Value: VERY HIGH

Friday, May 02, 2014

Brain surgery is not rocket science to a brain surgeon©

Inigo1

“You keep on using that word.  I do not think it means what you think it means.”

Some of the best job growth of the “RECOVERY!” 

We see sentiments like that all over from the “experts” this morning.  What a great example of why reports need to be analyzed.  The number of new jobs posted was an eye-widening 288k.  That is the best figure in a LONG time.  And then…reality takes over.  For perspective, 288k would be a great number to see early in an actual recovery, but for growth periods (like the one we should be in after 8 or 9 recovery months) it would be quite on the low average side.

Take a look at the futures reaction to the news.  It’s easy to see when they started seeing the details.

Futures after news May 2 2014

We would have expected very little change over the month as there were no momentous economic or policy shifts during April that would inspire a meaningful change, and we are, unfortunately, correct.  So, let’s get to it…

The headline number is 288k new hires for April 2014.  The unemployment rate dropped to 6.3%.  Net revisions to February and March 2014 numbers gives us a net gain of 36k.  That’s the end of the “good” news.

As for the 288k, only 273k are private sector adds.  Of that 273k, 32k are in construction.  That number represents a catch-up spike from the weather driven slowing in the sector.   As before, the rate changed disproportionately to the number of jobs added.  The unemployment rate decline of .4% matches the decline in the participation rate…exactly!  The participation rate fell another jaw dropping .4% in a single month.  It now stands at 62.8%, which you may recall is an all-time record low set back in October of 2013 and repeated in December.  Again, for perspective, had the participation rate remained steady from last month, the unemployment rate would have risen to 6.9%.  288k looks great until we hold it up against:

  • Civilian Labor Force shrank by 806k
  • Number of Employed People fell by 73k
  • Those not in the Labor Force ballooned by 988k

The only other number one could be excited about would be the decline of 733k in the number of unemployed persons, until we realize that the those are the folks who quit looking for work a month ago so they don’t count in the rate calculation.

The length of the work week is stagnant, overtime in manufacturing was unchanged resting at 3.5 hours, earnings are flat and those employed part time for economic reasons continues to rise.

So, we’ve now established and matched the worst labor participation rate in American history three times in the last seven months with over ten million people out of work.

Recovery?

 Vizzini 5-2-142

INCONTHEIVABLE ! ! !  

Thanks for reading and, please, stay tuned…

 Release Site: www.bls.gov

1,2 “The Princess Bride” Act III Communications 1987

Every effort is made to ensure accuracy of data transcription but accuracy cannot be guaranteed.  The official release site should be cross referenced.  The analysis represents the opinion of Blue World Asset Managers, Ltd. who does not warrant or guarantee predictions based on its analysis.

©Blue World Asset Managers, LTD Friday, May 02, 2014

Blue World Jobs Report Analysis 4-4-2014

Blue World Employment Situation Report Analysis

Release Date:  Usually the first Friday of each month

Release Site: www.bls.gov

Market Sensitivity: VERY HIGH

Management Value: VERY HIGH

Friday, April 04, 2014

Brain surgery is not rocket science to a brain surgeon©

How often did you find yourself in math class laughing out loud because arithmetic was so funny?  It is so rare for remedial math to be entertaining that we feel obligated to revisit the who’s-on-first dynamic of the employment numbers relative to the unemployment rate.  In January we added 145k, and the unemployment rate got better.  In February we got 162k, and the rate got worse.  Now we get 192k and rate is – wait for it – UNCHANGED!

By now most of us have heard the 192k with an unchanged rate of 6.7% headlines, so let’s do what we do and take a look at what it really means.

As usual, there were no seismic changes during March 2014, so we would expect that things are about the same, and they are…with a couple of insidious trends emerging that are way off the radar of the media folk  and “experts.”  We’ll get to those in a bit.

The “expert” consensus called for about 206k new hires with estimates covering a wide range from 175k on the low side to 275k on the high end.  Emphasis on the last in recognition of the likelihood that particular “expert” is from Colorado, voted in favor of the referendum to legalize pot and was partaking when rendering his estimate!  The 192k number is the net for total private hires as government neither added nor lost jobs for the month.  There was a significant upward revision to the February number from 175k to 197k, but that is still way short of what we’d consider acceptable in “normal” times much less 5 years into a “recovery.” (BTW, even with that revision the rate is ‘unchanged’)

The participation rate remains in record low territory, and in spite of an increase of .2 to 63.2, it languishes below the level of a year ago.  This is, of course, continued evidence of the bleeding of available work force.  Those workers 25 years and older with a Bachelor’s degree or better remain frustratingly unemployed at historically high rates.

The work week ticked up a bit but remains range bound and is no better than it was in March of 2013.  Average hourly wages moved backwards while weekly earners fared a little better, and overtime hours in manufacturing remains tightly range bound.

Now for the more insidious stuff…

Those employed part-time for economic reasons appear to be stair-stepping upward.  There were notable increases in the number of those unemployed between zero and 26 weeks, and the number of unemployed people rose in spite of the jobs total, participation rate and marginally attached number.  However, the big one comes from the oft-overlooked diffusion index in manufacturing.  To review, the diffusion index looks at the manufacturing sector as a whole, which is composed of 81 industries.  A diffusion index of 50 indicates as many industries added or remained neutral in terms of new hires as shed jobs.  For the first quarter of 2014 the index has declined January to March at the attention getting rate of 55.6, 51.9, 50.0.  Those numbers are rather startling but it gets worse when we look back and see that in March of 2013 the rate was 52.5.

If you run a business, manage people, invest real money or seek to make a meaningful contribution to the economy the posture must remain defensive because in spite of the irrational public markets behavior, false or foolish optimism, headlines and spin, we have no choice but to conclude that the “recovery”…well…isn’t.

Thanks for reading and, please, stay tuned…

Release Site: www.bls.gov

Every effort is made to ensure accuracy of data transcription but accuracy cannot be guaranteed.  The official release site should be cross referenced.  The analysis represents the opinion of Blue World Asset Managers, Ltd. who does not warrant or guarantee predictions based on its analysis.

©Blue World Asset Managers, LTD Friday, April 04, 2014