Blue World Employment Situation Report Analysis 6-7-13

Blue World Employment Situation Report Analysis

Release Date:  Usually the first Friday of each month

Release Site: www.bls.gov

Market Sensitivity: VERY HIGH

Management Value: VERY HIGH

Friday, June 07, 2013

Brain surgery is not rocket science to a brain surgeon©

Perhaps the most exciting thing about the jobs report was our typo last night on Twitter!  We were asked for our prediction and we said “more of the same” but we typo’d >200k new jobs instead of <.  Sorry.  The appropriate parties are being waterboarded…in Egypt, of course.

The rest of it, well, we nailed it.  I wish we could claim some genius status for that, but how could we?  The pattern is well established, and there have been no economic or policy shifts during the last month that would precipitate any meaningful change.

The biggest “news” out of this report came in the form of adjustments made to the prior two months which demonstrate a net 12,000 fewer jobs than initially reported.

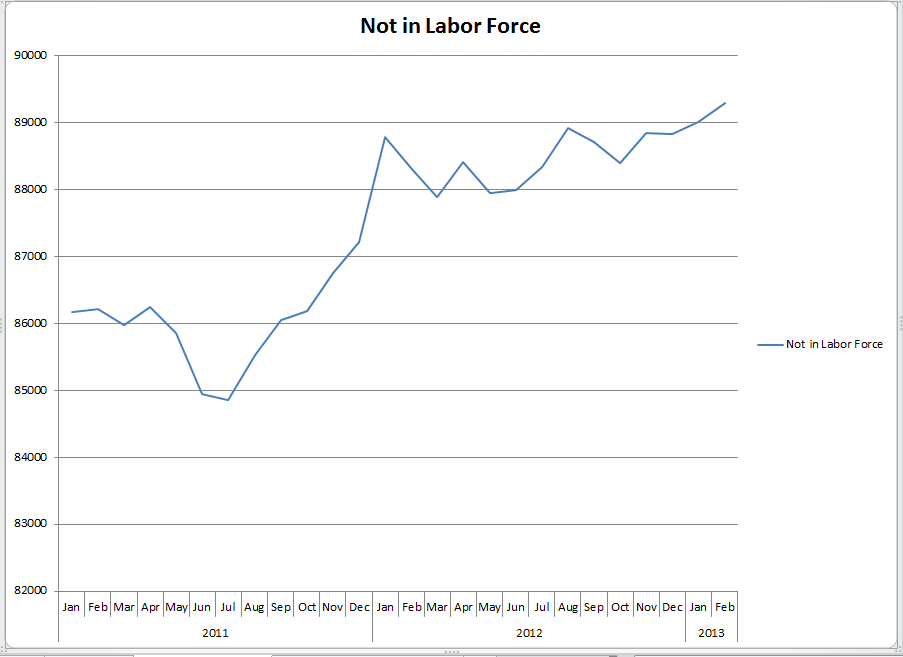
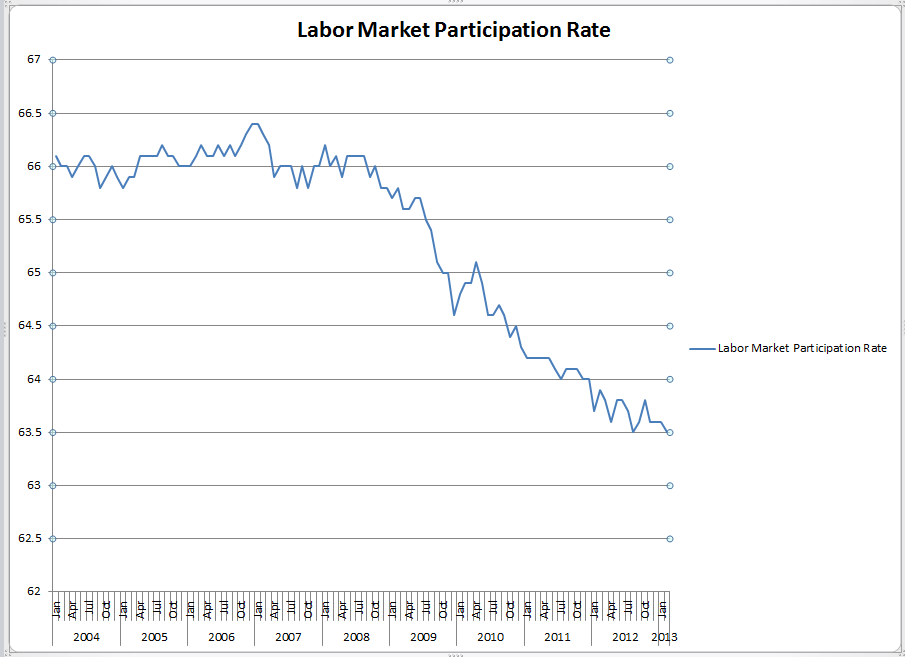
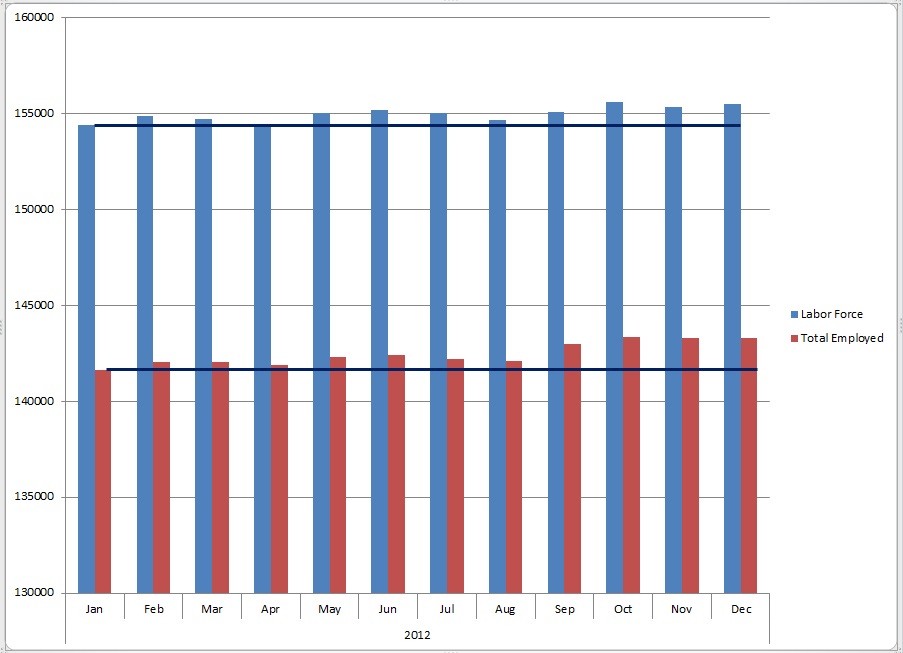
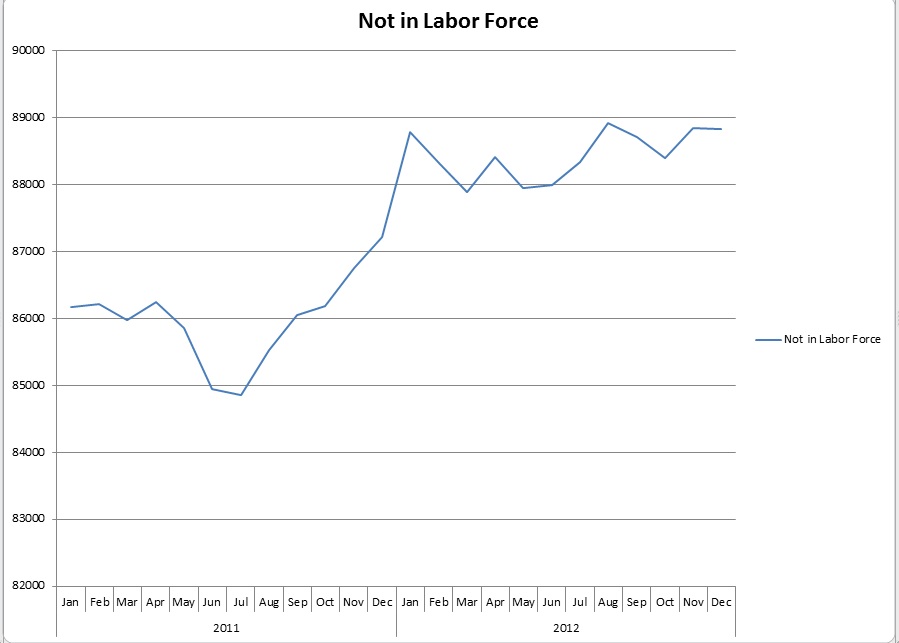
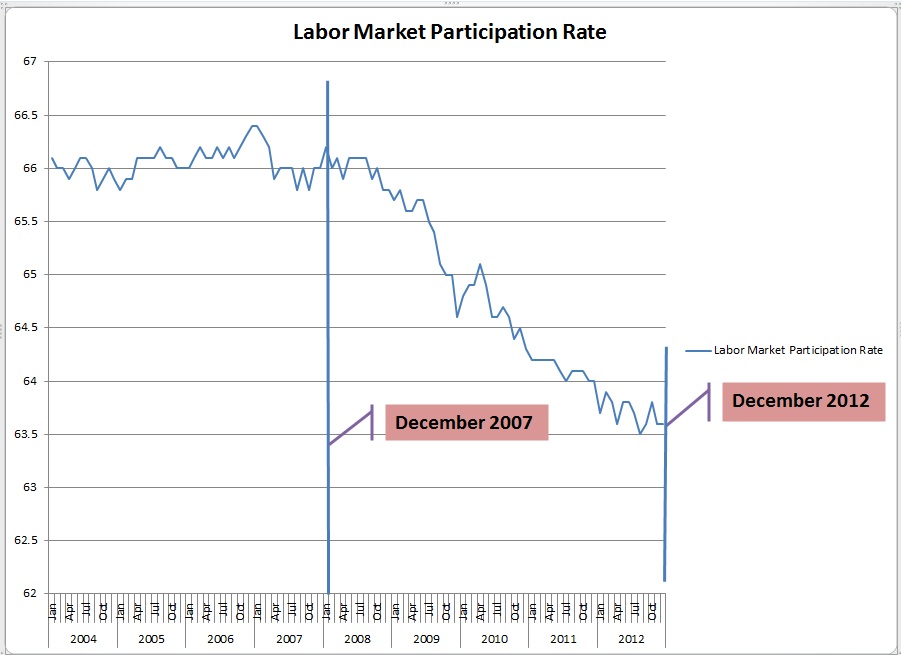
175 thousand new payrolls are reported for May, which is still up to 75 thousand short of break-even.  The number of those reporting as employed rose, but so did the number of those reporting as unemployed.  This month the growth in the labor force was proportionately larger than the gain in the number of employed persons, hence the uptick in the rate to 7.6%.  All were uninspiring as validated by the continued weakness in employment-population ratio and the participation rate which, by the way, are each equal to and below where they were in May of 2012, respectively.  Overall, wages are still stagnant and the work week length remains flat.

Manufacturing Has Become a Real Concern

In addition to developing a three month job shedding trend, weekly manufacturing overtime among all employees continues too short and unchanged.  More troubling, however, is that the production and non-supervisory set has established a three month downward trend from 4.4 hours of overtime per week in March to 4.2 hours in May.  The diffusion index is still a contractionary sub-50 reading.  All of this is consistent with what we saw during the month coming out of the regional Fed reports where four of five were negative.  On Monday we Tweeted sarcastically regarding the “experts’” surprise at the negative ISM report.  Perhaps the anemic GDP could have offered them more clues…

As much as we like them, there is no need for multi-colored charts and graphs this month.  The patterns are, unfortunately, consistent.

We are seeing words from “decent” to “fabulous” in describing this report and the “continued recovery” of the labor market.  The markets are responding accordingly, but if you invest real money, manage or hire real people or are responsible for the wealth of yourself or others make no mistake, this is a very poor report wearing the makeup of headline numbers and media spin.

This is the United States of America.  When was 7 percent unemployment EVER acceptable for even a short time?  Unemployment above 7 percent for this long with stagnation from the labor force size to wages is utterly unacceptable and completely avoidable.  We can’t say it often enough.  Policy Matters!

Thanks for reading and, please, stay tuned…

Release Site: www.bls.gov

Every effort is made to ensure accuracy of data transcription but accuracy cannot be guaranteed.  The official release site should be cross referenced.  The analysis represents the opinion of Blue World Asset Managers, Ltd. who does not warrant or guarantee predictions based on its analysis.

©Blue World Asset Managers, LTD Friday, June 07, 2013

Blue World Employment Situation Analysis 3-8-2013

Blue World Employment Situation Report Analysis

Release Date:  Usually the first Friday of each month

Release Site: www.bls.gov

Market Sensitivity: VERY HIGH

Management Value: VERY HIGH

Friday, March 08, 2013

Brain surgery is not rocket science to a brain surgeon©

Not bad.  Not great, but not as bad as what we’ve become accustomed to.  There are those who will offer politically motivated assessments of this report, and both sides will have ammunition, but no matter who you are, a number like 236 thousand is nothing to poo poo when we haven’t seen anything north of 200k in quite some time.

Big gains were tallied in the goods producing sector with construction leading the way.  In the private services sector, information services, retail, business services, temp jobs and, of course, health care added meaningful totals.

While the overall length of the work week remains uninspiring, there was a notable improvement in manufacturing (durable goods) which jumped from 41 to 41.3 hours.  In and of itself 41.3 is nothing to write home about, but it does represent a breakout from the recent term pattern.

Wages were also up by respectable amounts in certain areas including weekly construction and manufacturing pay.

The downside…Let’s start here.  7.7% unemployment in the United States of America is simply unacceptable no matter what the current size of the labor force.  Yes, the rate is down again this month but that’s because, you guessed it, new hires went up and the labor force got smaller.

Here are the latest charts.

Labor Force vs. Total Employed

Labor Force vs. Total Employed

Not in Labor Force

Not in Labor Force

Labor Force Participation Rate

Labor Force Participation Rate

It’s difficult to get too excited about the number of new jobs, even at +200k, and the unemployment rate when we continue to see contractions in the size of the labor force and participation rates.  If the labor force were the same size now as it was back in ’08-’09  the unemployment rate would be well above 10%.  As we’ve said, we can’t improve the labor market by reducing the number of workers in it.

So, all in all, we would consider this a mixed report.  That is a HUGE improvement over what we’ve had to work with for a time period no longer measured in months or even quarters but years!  PLEASE remember, no report is meaningful unto itself.  The upside in this report only matters if it becomes the beginning of a sustainable trend of improvement.  You know we’ve seen this head fake before, so don’t run right out and open the purse strings into a strong tail wind just yet.

BTW: Last month we pointed toward the income and outlays figures as something to watch.  The reports were as expected, down.  Even with the income improvements seen here the tax bite appears to be overwhelming the increases.  Overall this month the total complexion of the economy remains unchanged at mixed, with about as many negative reports as positive and today’s jobs report being one of the brighter spots for a change.  Key reports to watch this month will be income and outlays, GDP and productivity, which took a bit hit in February.

Well, it wouldn’t be a Blue World analysis if we didn’t mention the market.  Doesn’t its behavior just kill ya?  All these lackluster jobs reports headlines with deplorable detail and the market just flies.  Today the headlines are a little better, and there are actually some bright spots in the detail yet the market opens ho hum, and as of 9:00a Central time has turned decidedly downward.  Go figure.

As always, thanks for reading and please stay tuned…

Release Site: www.bls.gov

Every effort is made to ensure accuracy of data transcription but accuracy cannot be guaranteed.  The official release site should be cross referenced.  The analysis represents the opinion of Blue World Asset Managers, Ltd. who does not warrant or guarantee predictions based on its analysis.

©Blue World Asset Managers, LTD Friday, March 08, 2013

Blue World Employment Situation Report Analysis 02-01-2013

Blue World Employment Situation Report Analysis

Release Date:  Usually the first Friday of each month

Release Site: www.bls.gov

Market Sensitivity: VERY HIGH

Management Value: VERY HIGH

Friday, February 01, 2013

Brain surgery is not rocket science to a brain surgeon©

The operative word today is…spin.  When we saw the jobs numbers at first pass we thought “wow, this is ugly.”  Now we go and read the BLS summary and some stuff around other notable publications and are quite amused by the characterizations of the report.  For example, do you notice how when the rate falls by a tenth that is an “improvement,” but when it ticks up a tenth it is “essentially unchanged?”  The Journal’s analysis wants to focus on upward revisions to last year’s estimates from an average of 153k per month to 181k per month.  That means instead of being 100k short of breakeven per month we’re only 70k short of breakeven per month?  Say nothing of the fact that 2012 is over!  Are we going to make different business and investment decisions based on an estimated “improvement” from last year?  It’s utterly ludicrous!

This is why you read us, folks.  No spin, just an objective analysis of the data (with occasional commentary on how policy affects the data.)  Remember, the data is not “good” or “bad.”  It’s just data that requires the people who invest real money and employ real people to make sound decisions based on the objective analysis of the data.  So, analysis can be “good” or “bad” and decisions can be “good” or “bad” but the data is just data.

Some quick numbers, then…  The rate ticked up to 7.9%, but so what?  We’ve shown how the unemployment rate is a poor indicator of labor market health these days based on the ratio of the labor force size and the total number employed.  This month is no exception.  That observation is validated by the facts that the participation rate is unchanged for three months during an overall downward trend during 2012 (as long as we’re focusing on 2012), the total number of people not in the labor force increased, and the total number of people reporting as in the labor force but unemployed rose again!

The work week for all employees is unchanged and short for three months, but construction AND manufacturing showed  a reduction in the length of the work week for all employees as well as production and non-supervisory employees.  That hasn’t happened in a while.  There were notable downward revisions to hourly and weekly wages in manufacturing, and the preliminary data for last month shows a decline over those downward revisions.

Is there more? Yeah, but I think we get it.

We analyze over one hundred reports per month.  Occasionally we do a post regarding other economic reports, but the employment report is the one we post our analysis of every month.  That’s because it gives the investor and business manager the most insight into the economy.  Why?  Because it tells us who’s not working and for how long; who is working and for how many hours per week in which industries; plus how much they’re making.  That eliminates most of the potential surprises in the other reports that come out.  For example, was the negative GDP report from earlier this week a surprise?  Not if you’ve followed us!

I’ll be on CBS radio Chicago (WBBM AM 780, 105.9 FM) to analyze next month’s jobs report and the economy in general on Friday, March 8th.  A couple of the reports we will be paying particular attention to during month are the consumer mood reports and the income and outlays reports.   The consumer mood indicators have already taken a beating and we expect those to remain weak.  We predicted that based on the realization that everybody’s paychecks got lighter, not just the $250k/yr + crowd.  Next month the effect of 2012 year-end bonuses and dividend income should be gone but the tax bite will still be there.  Add this to what we said about wages in manufacturing and we can see the potential for income and outlays to fall tracing the consumer mood values.  If that plays out we’ll start to see the effects reflect in the weekly data on retail sales, durable goods orders, etc.

The market is still rising, but remember how fickle it can be.  Let’s ride the wave as long and as well as we can, but make sure the defense is ready to deploy.  We advise business managers to be watching the economic reports and industry data as closely as their own internals with plans in place for various hypotheticals.  Call us if you’d like some help with that.

Have a great February.  Thanks for reading and, please, stay tuned…

Release Site: www.bls.gov

Every effort is made to ensure accuracy of data transcription but accuracy cannot be guaranteed.  The official release site should be cross referenced.  The analysis represents the opinion of Blue World Asset Managers, Ltd. who does not warrant or guarantee predictions based on its analysis.

©Blue World Asset Managers, LTD Friday, February 01, 2013

Blue World Employment Situation Analysis 01-04-2013

Blue World Employment Situation Report Analysis

Release Date:  Usually the first Friday of each month

Release Site: www.bls.gov

Market Sensitivity: VERY HIGH

Management Value: VERY HIGH

Friday, January 04, 2013

Brain surgery is not rocket science to a brain surgeon©

There are two flags on the play…

Stagnant.  That’s about the best assessment we can offer for the last quarter of 2012 with regard to the labor picture.  That wouldn’t be so bad if we were stagnant at a much higher point.  There are some small positives hiding under the bigger negatives but they essentially offset kind of like a 15 yard penalty on the defense can be offset by a 5 yard infraction against the offense during the same play.  So, STAGNANT.

What does that mean?  We’ll actually let the charts do the heavy lifting this month but those with a Bachelor’s or higher and are over 25 are still unemployed at 3.9%.  That’s never been this high for this long since records have been kept.  Any movement in the unemployment rate has coincided with an offsetting move in the labor force size.  This has, of course, been a theme for that last couple of years where an increase in the rate was not necessarily “bad” and a decrease was not necessarily “good.”  The bottom line continues to be a pattern inconsistent with any meaningful economic recovery the likes of which we have been used to.  If you missed the post that demonstrated this graphically you should have a look at it as the pattern has not changed. 

The number of those reporting as employed rose 28,000 in December 2012 but those reporting as unemployed rose by 164,000 which is astronomically high as is the number of those not in the labor force.  The participation rate continues its downward trend, the number of those unemployed between 1 and 26 weeks jumped rather dramatically in December and overtime hours in manufacturing remain uninspiring.

So, what are some of the positives we mentioned?  Wage increases in a few areas actually outpaced inflation last month and the number of those reporting at work part time because they couldn’t find enough to do or a full time gig was down a bit.


2012 Labor Force Size Continues to Under Perform Employed Totals

2012 Labor Force Size Continues to Under Perform Employed TotalsAfter a small dip in 2011 the Number of Those Not In The Labor Force Exploded and Now is Moving Laterally

After a Small Dip in 2011 the Number of Those Not In The Labor Force Exploded and Now is Moving Laterally

A historically Stable Participation Rate Has not Begun to Recover From a Collapse that Began in 2007

A Historically Stable Participation Rate Has not Begun to Recover From a Collapse that Began in 2007

After a Small Dip in 2011 the Number of Those Not In The Labor Force Exploded and Now is Moving Laterally


We mention this occasionally and the first post of a new year always seems a good time to reiterate that there is a tendency to categorize data as “good” or “bad.”  From our point of view the data is neither.  It’s just data.   Our job is to help businesses and investors react appropriately to the data at a point somewhere between cautious and aggressive.  For a while all the data pointed distinctly toward caution.  The last few weeks we’ve seen conflicting signals intra and inter reporting.  For us, that is more cautionary than definable trends for obvious reasons.  We’ll need to watch very closely over the coming weeks to see if any meaningful patterns develop in either direction.  In the meantime we’d lobby the refs to throw a flag for roughing the analysts!

Thanks for reading, HAPPY NEW YEAR and please, stay tuned…

Release Site: www.bls.gov

Every effort is made to ensure accuracy of data transcription but accuracy cannot be guaranteed.  The official release site should be cross referenced.  The analysis represents the opinion of Blue World Asset Managers, Ltd. who does not warrant or guarantee predictions based on its analysis.

©Blue World Asset Managers, LTD Friday, January 04, 2013

Blue World Employment Situation Report Analysis 12-07-2012

Release Date:  Usually the first Friday of each month

Release Site: www.bls.gov

Market Sensitivity: VERY HIGH

Management Value: VERY HIGH

Friday, December 07, 2012

Brain surgery is not rocket science to a brain surgeon©

C’mon everybody.  Sing along.  You know the words to this song.  The economy added a net 146,000 jobs and the unemployment rate dropped to 7.7%.  I admit we were unable to be even cautiously optimistic about the headline numbers due to the details in some other reports out during the month, especially regional manufacturing data and the GDP estimate.  We had predicted that GDP would be revised lower but it was actually revised higher.  A glimmer of optimism was squelched immediately by the detail which showed the GDP increase coming on the inventory side while the demand side slid.  That indicates a data blip as opposed to the emergence of a sustainable upward trend.

November labor details tell a familiar story so here are the most illuminating.  We got 146,000 new jobs but the labor force suffered a huge 350,000 worker reduction.  The participation rate fell another .2% and the number of employed people fell by another 122,000.  The work week remained flat for all employees and the overtime hours in manufacturing are still unchanged at 3.2 hours per week.  There was some improvement in wages reported but still not enough to outpace inflation.  Additionally, pay readings have been volatile and given to significant revisions over the last couple of years so we can’t put too much stock in single-month changes.  College educated unemployment is still way too high but at least has been below 4% (3.8) for two months in a row.  That number needs to go below 2.5% in order for any real recovery to be underway.

On the news there was a vertical spike in the S&P 500 futures but it only got back to about even on last night’s close.  As the detail is digested and weak consumer sentiment numbers worked their way into the mix, the charts illustrated a retreat back toward the baseline and now (9:56a C) the S&P has gone fractionally negative while crude and corn retreat and gold is choppy and largely lateral.

So far the outcome of the election has done little to quell any of the uncertainty that has hung over the economy for the last few years.  Aggression in the Middle East, continued turmoil in Europe, fiscal cliff worries, unresolved tax policy and anxiety over the implementation of Obama Care in the face of what appear to be developing new legal challenges to the Affordable Care Act maintain their grip on those we rely on to spend, invest and hire.

The markets continue their upward trend.  While we have been happy to participate in the run we continue to be very cautious and we’re bringing the safety net up tighter and tighter.  We have significant concerns about what seems to drive the markets these days.  Government commentary, be it from our Fed or European leaders, have greater impact on market sentiment than economic and corporate fundamentals.  We believe this as a driver is unsustainable and at some point market fundamentals will have to trump. When will that happen?  If you had told us in 1995 that U.S. Ambassadors were being raped and murdered, Palestine had been admitted to the U.N., Iran was close to nukes, Israel was engaged in missile play, Syria was readying chemical weapons to use on its own people, North Korea was rattling its saber, the government owned private car companies, one sixth of the economy was being nationalized, there were only three banks left, GDP was under 3%, unemployment was over 7.5%, corporate profits were mixed as revenues begin to slip across the board and the markets are UP, we’d have recommended you seek professional intervention from a qualified mental health provider.  Historically these conditions would drive the markets to extreme lows.  Today, however, they continue to climb.  We’ll ride the wave, too, but the defense is still on the field and ready to play when reality and perception align.  Whatever defensive strategy you/your financial advisor employ, we think it prudent to keep it executable at very short notice.

This is our final jobs analysis to post for 2012.  Thanks so much for reading and commenting.  God bless you and your families.  Have a very Merry Christmas and a Happy New Year.  We’ll see ya on the other side.

GO IRISH!!

Release Site: www.bls.gov

Every effort is made to ensure accuracy of data transcription but accuracy cannot be guaranteed.  The official release site should be cross referenced.  The analysis represents the opinion of Blue World Asset Managers, Ltd. who does not warrant or guarantee predictions based on its analysis.

©Blue World Asset Managers, LTD Friday, December 07, 2012