
Blue World Employment Situation Report Analysis
Release Date: Usually the first Friday of each month
Release Site: www.bls.gov
Market Sensitivity: VERY HIGH
Management Value: VERY HIGH
Friday, January 04, 2013
Brain surgery is not rocket science to a brain surgeon©
There are two flags on the play…
Stagnant. That’s about the best assessment we can offer for the last quarter of 2012 with regard to the labor picture. That wouldn’t be so bad if we were stagnant at a much higher point. There are some small positives hiding under the bigger negatives but they essentially offset kind of like a 15 yard penalty on the defense can be offset by a 5 yard infraction against the offense during the same play. So, STAGNANT.
What does that mean? We’ll actually let the charts do the heavy lifting this month but those with a Bachelor’s or higher and are over 25 are still unemployed at 3.9%. That’s never been this high for this long since records have been kept. Any movement in the unemployment rate has coincided with an offsetting move in the labor force size. This has, of course, been a theme for that last couple of years where an increase in the rate was not necessarily “bad” and a decrease was not necessarily “good.” The bottom line continues to be a pattern inconsistent with any meaningful economic recovery the likes of which we have been used to. If you missed the post that demonstrated this graphically you should have a look at it as the pattern has not changed.
The number of those reporting as employed rose 28,000 in December 2012 but those reporting as unemployed rose by 164,000 which is astronomically high as is the number of those not in the labor force. The participation rate continues its downward trend, the number of those unemployed between 1 and 26 weeks jumped rather dramatically in December and overtime hours in manufacturing remain uninspiring.
So, what are some of the positives we mentioned? Wage increases in a few areas actually outpaced inflation last month and the number of those reporting at work part time because they couldn’t find enough to do or a full time gig was down a bit.
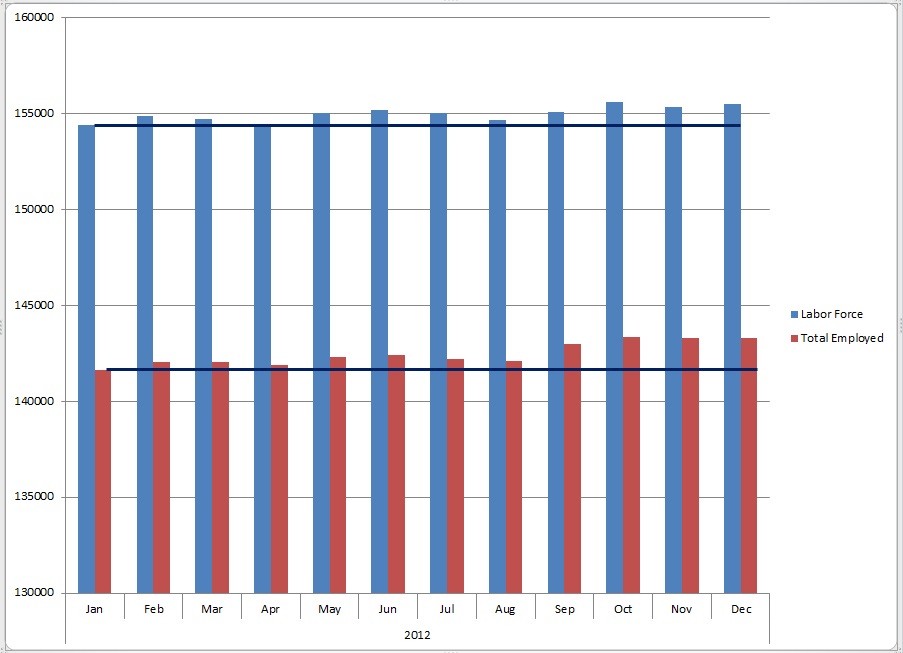
2012 Labor Force Size Continues to Under Perform Employed Totals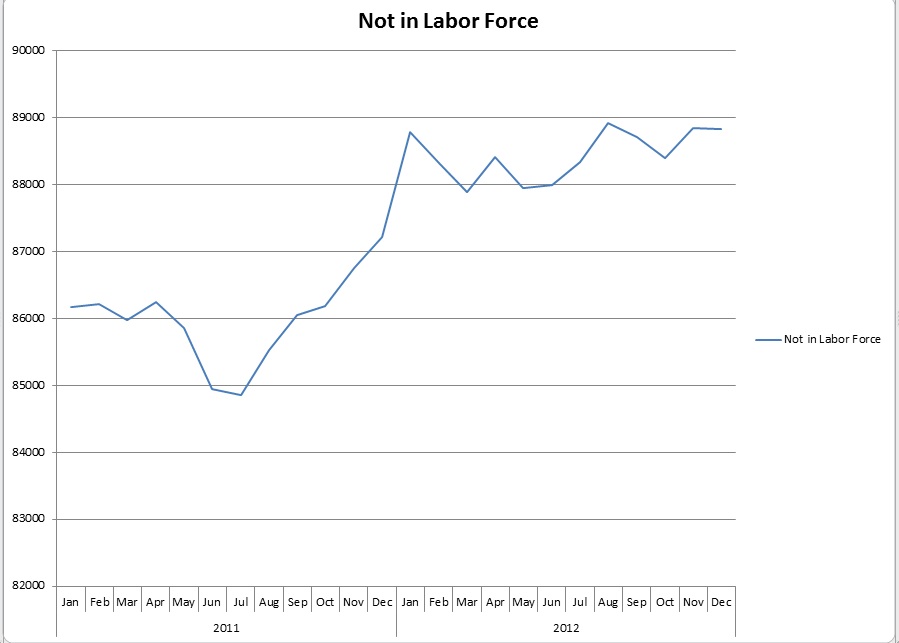
After a Small Dip in 2011 the Number of Those Not In The Labor Force Exploded and Now is Moving Laterally
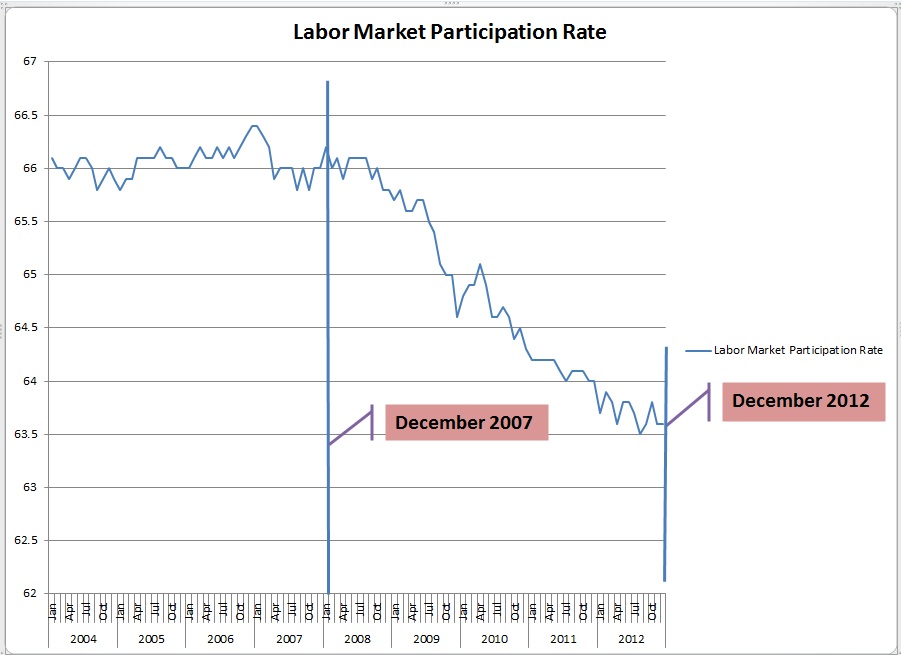
A Historically Stable Participation Rate Has not Begun to Recover From a Collapse that Began in 2007
After a Small Dip in 2011 the Number of Those Not In The Labor Force Exploded and Now is Moving Laterally
We mention this occasionally and the first post of a new year always seems a good time to reiterate that there is a tendency to categorize data as “good” or “bad.” From our point of view the data is neither. It’s just data. Our job is to help businesses and investors react appropriately to the data at a point somewhere between cautious and aggressive. For a while all the data pointed distinctly toward caution. The last few weeks we’ve seen conflicting signals intra and inter reporting. For us, that is more cautionary than definable trends for obvious reasons. We’ll need to watch very closely over the coming weeks to see if any meaningful patterns develop in either direction. In the meantime we’d lobby the refs to throw a flag for roughing the analysts!
Thanks for reading, HAPPY NEW YEAR and please, stay tuned…
Release Site: www.bls.gov
Every effort is made to ensure accuracy of data transcription but accuracy cannot be guaranteed. The official release site should be cross referenced. The analysis represents the opinion of Blue World Asset Managers, Ltd. who does not warrant or guarantee predictions based on its analysis.
©Blue World Asset Managers, LTD Friday, January 04, 2013


