Blue World Employment Situation Report Analysis 02-01-2013

Blue World Employment Situation Report Analysis

Release Date:  Usually the first Friday of each month

Release Site: www.bls.gov

Market Sensitivity: VERY HIGH

Management Value: VERY HIGH

Friday, February 01, 2013

Brain surgery is not rocket science to a brain surgeon©

The operative word today is…spin.  When we saw the jobs numbers at first pass we thought “wow, this is ugly.”  Now we go and read the BLS summary and some stuff around other notable publications and are quite amused by the characterizations of the report.  For example, do you notice how when the rate falls by a tenth that is an “improvement,” but when it ticks up a tenth it is “essentially unchanged?”  The Journal’s analysis wants to focus on upward revisions to last year’s estimates from an average of 153k per month to 181k per month.  That means instead of being 100k short of breakeven per month we’re only 70k short of breakeven per month?  Say nothing of the fact that 2012 is over!  Are we going to make different business and investment decisions based on an estimated “improvement” from last year?  It’s utterly ludicrous!

This is why you read us, folks.  No spin, just an objective analysis of the data (with occasional commentary on how policy affects the data.)  Remember, the data is not “good” or “bad.”  It’s just data that requires the people who invest real money and employ real people to make sound decisions based on the objective analysis of the data.  So, analysis can be “good” or “bad” and decisions can be “good” or “bad” but the data is just data.

Some quick numbers, then…  The rate ticked up to 7.9%, but so what?  We’ve shown how the unemployment rate is a poor indicator of labor market health these days based on the ratio of the labor force size and the total number employed.  This month is no exception.  That observation is validated by the facts that the participation rate is unchanged for three months during an overall downward trend during 2012 (as long as we’re focusing on 2012), the total number of people not in the labor force increased, and the total number of people reporting as in the labor force but unemployed rose again!

The work week for all employees is unchanged and short for three months, but construction AND manufacturing showed  a reduction in the length of the work week for all employees as well as production and non-supervisory employees.  That hasn’t happened in a while.  There were notable downward revisions to hourly and weekly wages in manufacturing, and the preliminary data for last month shows a decline over those downward revisions.

Is there more? Yeah, but I think we get it.

We analyze over one hundred reports per month.  Occasionally we do a post regarding other economic reports, but the employment report is the one we post our analysis of every month.  That’s because it gives the investor and business manager the most insight into the economy.  Why?  Because it tells us who’s not working and for how long; who is working and for how many hours per week in which industries; plus how much they’re making.  That eliminates most of the potential surprises in the other reports that come out.  For example, was the negative GDP report from earlier this week a surprise?  Not if you’ve followed us!

I’ll be on CBS radio Chicago (WBBM AM 780, 105.9 FM) to analyze next month’s jobs report and the economy in general on Friday, March 8th.  A couple of the reports we will be paying particular attention to during month are the consumer mood reports and the income and outlays reports.   The consumer mood indicators have already taken a beating and we expect those to remain weak.  We predicted that based on the realization that everybody’s paychecks got lighter, not just the $250k/yr + crowd.  Next month the effect of 2012 year-end bonuses and dividend income should be gone but the tax bite will still be there.  Add this to what we said about wages in manufacturing and we can see the potential for income and outlays to fall tracing the consumer mood values.  If that plays out we’ll start to see the effects reflect in the weekly data on retail sales, durable goods orders, etc.

The market is still rising, but remember how fickle it can be.  Let’s ride the wave as long and as well as we can, but make sure the defense is ready to deploy.  We advise business managers to be watching the economic reports and industry data as closely as their own internals with plans in place for various hypotheticals.  Call us if you’d like some help with that.

Have a great February.  Thanks for reading and, please, stay tuned…

Release Site: www.bls.gov

Every effort is made to ensure accuracy of data transcription but accuracy cannot be guaranteed.  The official release site should be cross referenced.  The analysis represents the opinion of Blue World Asset Managers, Ltd. who does not warrant or guarantee predictions based on its analysis.

©Blue World Asset Managers, LTD Friday, February 01, 2013

Blue World Employment Situation Report Analysis 12-07-2012

Release Date:  Usually the first Friday of each month

Release Site: www.bls.gov

Market Sensitivity: VERY HIGH

Management Value: VERY HIGH

Friday, December 07, 2012

Brain surgery is not rocket science to a brain surgeon©

C’mon everybody.  Sing along.  You know the words to this song.  The economy added a net 146,000 jobs and the unemployment rate dropped to 7.7%.  I admit we were unable to be even cautiously optimistic about the headline numbers due to the details in some other reports out during the month, especially regional manufacturing data and the GDP estimate.  We had predicted that GDP would be revised lower but it was actually revised higher.  A glimmer of optimism was squelched immediately by the detail which showed the GDP increase coming on the inventory side while the demand side slid.  That indicates a data blip as opposed to the emergence of a sustainable upward trend.

November labor details tell a familiar story so here are the most illuminating.  We got 146,000 new jobs but the labor force suffered a huge 350,000 worker reduction.  The participation rate fell another .2% and the number of employed people fell by another 122,000.  The work week remained flat for all employees and the overtime hours in manufacturing are still unchanged at 3.2 hours per week.  There was some improvement in wages reported but still not enough to outpace inflation.  Additionally, pay readings have been volatile and given to significant revisions over the last couple of years so we can’t put too much stock in single-month changes.  College educated unemployment is still way too high but at least has been below 4% (3.8) for two months in a row.  That number needs to go below 2.5% in order for any real recovery to be underway.

On the news there was a vertical spike in the S&P 500 futures but it only got back to about even on last night’s close.  As the detail is digested and weak consumer sentiment numbers worked their way into the mix, the charts illustrated a retreat back toward the baseline and now (9:56a C) the S&P has gone fractionally negative while crude and corn retreat and gold is choppy and largely lateral.

So far the outcome of the election has done little to quell any of the uncertainty that has hung over the economy for the last few years.  Aggression in the Middle East, continued turmoil in Europe, fiscal cliff worries, unresolved tax policy and anxiety over the implementation of Obama Care in the face of what appear to be developing new legal challenges to the Affordable Care Act maintain their grip on those we rely on to spend, invest and hire.

The markets continue their upward trend.  While we have been happy to participate in the run we continue to be very cautious and we’re bringing the safety net up tighter and tighter.  We have significant concerns about what seems to drive the markets these days.  Government commentary, be it from our Fed or European leaders, have greater impact on market sentiment than economic and corporate fundamentals.  We believe this as a driver is unsustainable and at some point market fundamentals will have to trump. When will that happen?  If you had told us in 1995 that U.S. Ambassadors were being raped and murdered, Palestine had been admitted to the U.N., Iran was close to nukes, Israel was engaged in missile play, Syria was readying chemical weapons to use on its own people, North Korea was rattling its saber, the government owned private car companies, one sixth of the economy was being nationalized, there were only three banks left, GDP was under 3%, unemployment was over 7.5%, corporate profits were mixed as revenues begin to slip across the board and the markets are UP, we’d have recommended you seek professional intervention from a qualified mental health provider.  Historically these conditions would drive the markets to extreme lows.  Today, however, they continue to climb.  We’ll ride the wave, too, but the defense is still on the field and ready to play when reality and perception align.  Whatever defensive strategy you/your financial advisor employ, we think it prudent to keep it executable at very short notice.

This is our final jobs analysis to post for 2012.  Thanks so much for reading and commenting.  God bless you and your families.  Have a very Merry Christmas and a Happy New Year.  We’ll see ya on the other side.

GO IRISH!!

Release Site: www.bls.gov

Every effort is made to ensure accuracy of data transcription but accuracy cannot be guaranteed.  The official release site should be cross referenced.  The analysis represents the opinion of Blue World Asset Managers, Ltd. who does not warrant or guarantee predictions based on its analysis.

©Blue World Asset Managers, LTD Friday, December 07, 2012

A Flute With No Holes Is Not a Flute and A Recovery With No Jobs Is Not a Recovery.

Friday, October 12, 2012

Ignorance is curable. Stupid is forever.©


In our jobs report analysis last week we said what we’ve been saying for a long time.  We are not in a “recovery” because there is no such thing as a “recovery” without an expanding labor market.

So, what should a recovery look like?

Several of you e-mailed or called and pointed out that we’ve been demonstrating what a recovery doesn’t look like, but we haven’t really shown what a real recovery does look like. EXCELLENT POINT.  Thank you!

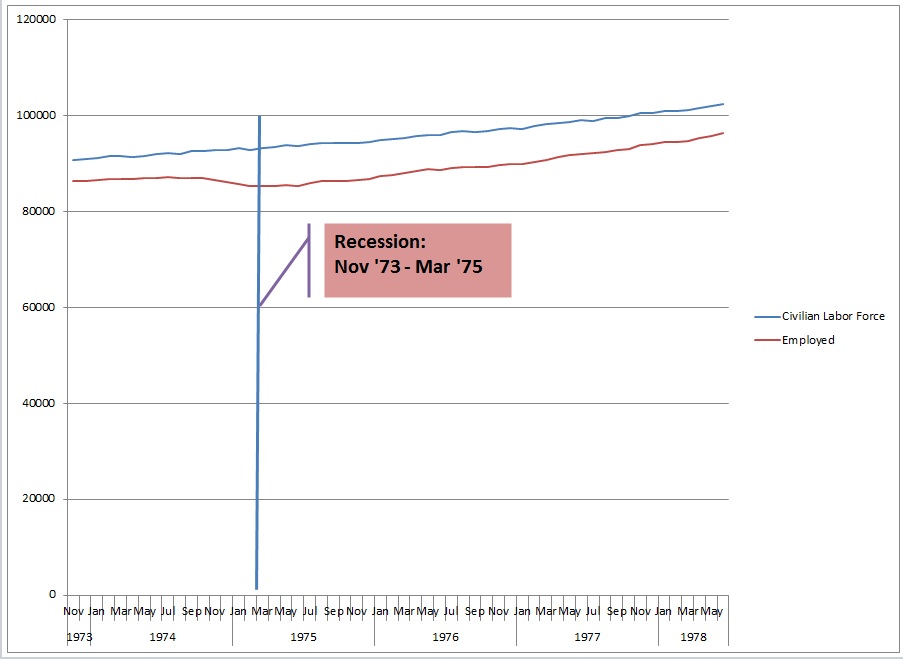
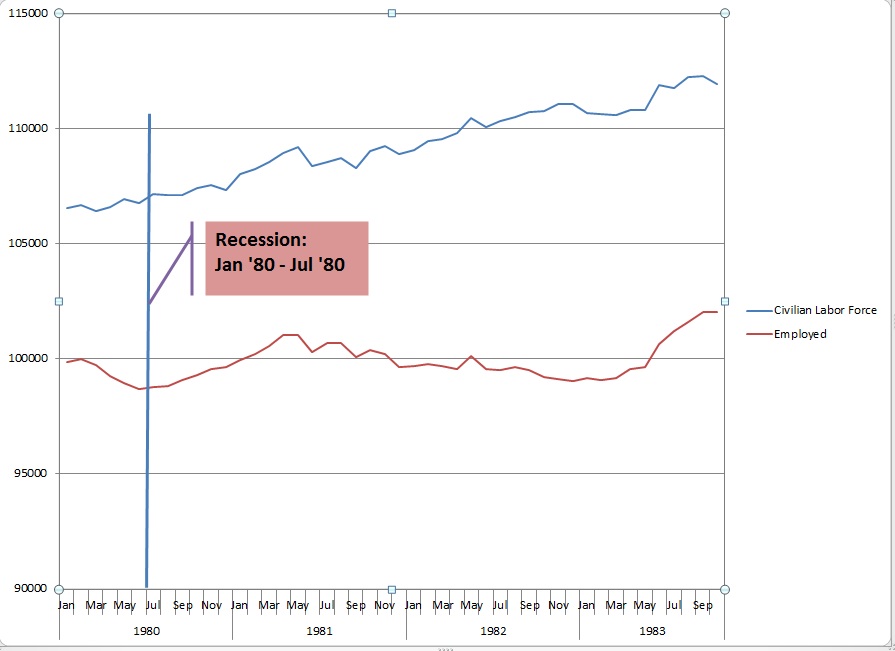
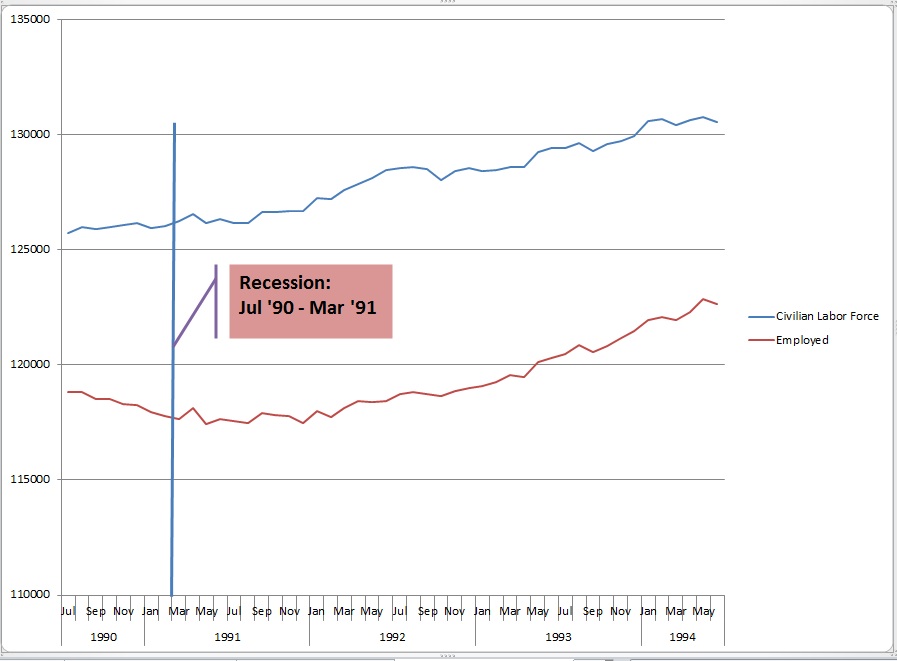
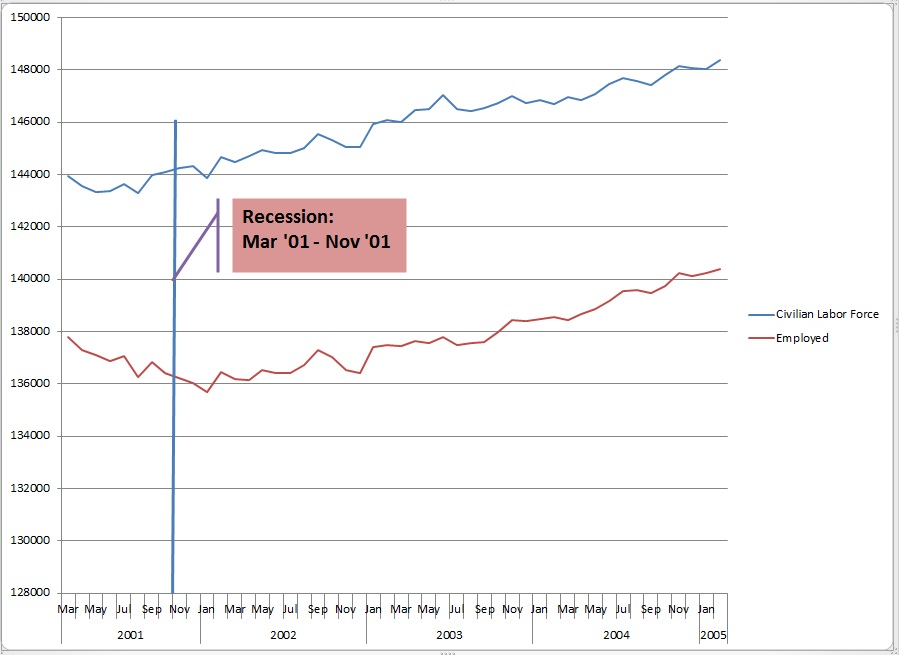
We dropped everything else this week to do the research, compile the data and generate the graphs so you can compare this “recovery” period to those of the past five recessions going back to 1973.

A true economic recovery following a recession necessarily features an expanding labor market.  An expanding labor market consists of two key elements.  One is the number of people reporting as available to work (the civilian labor force) and the other is the number of the civilian labor force members that have a job (total employed).   In order to be in a recovery BOTH of those groups need to demonstrate expansion.

7.8% is not credible because…

As we discussed last week, no one finds a .3% drop in a single month to be credible.  With over 12 million people out of work, 100,000 new jobs just can’t move the needle like that.  Heck, a couple of months ago an increase of 163,000 jobs (since revised lower) sent the unemployment rate up!  How can this be?  Without going into the detail, it is very simple arithmetic.  If the growth in new jobs outpaces the growth of the civilian labor force the percent unemployed will fall even though things aren’t getting better.  So, the labor market is not improving unless the unemployment rate falls in the face of an expanding civilian labor force AND an increase in the number of new hires.  Beyond that, it just doesn’t fit with all the other data out there.  For example, we need about 250,000 new jobs per month just to break even!  Our GDP is at 1.3% (about .9% if we take out inventories).  To get our unemployment rate down to 7.8% our GDP would need to have been about 4%.

Since last we spoke…

We are not conspiracy theorists, but come on…  Are we expected to believe the big upward revision in new government jobs was the portion that was slow to report?  Are we asked to forget that government jobs don’t signal private sector expansion?  We found out that the administration “secured” an agreement with Lockheed Martin to postpone layoff announcements until after the election.  On Thursday 10/11 an equally implausible drop in first-time unemployment benefit claims was trumpeted as the best in four years.  Hours later we learned that California’s count wasn’t included.  When we add that, the numbers aren’t so good and, of course, last week’s numbers were revised up.  Like we said last week, if these are the shenanigans we know about…

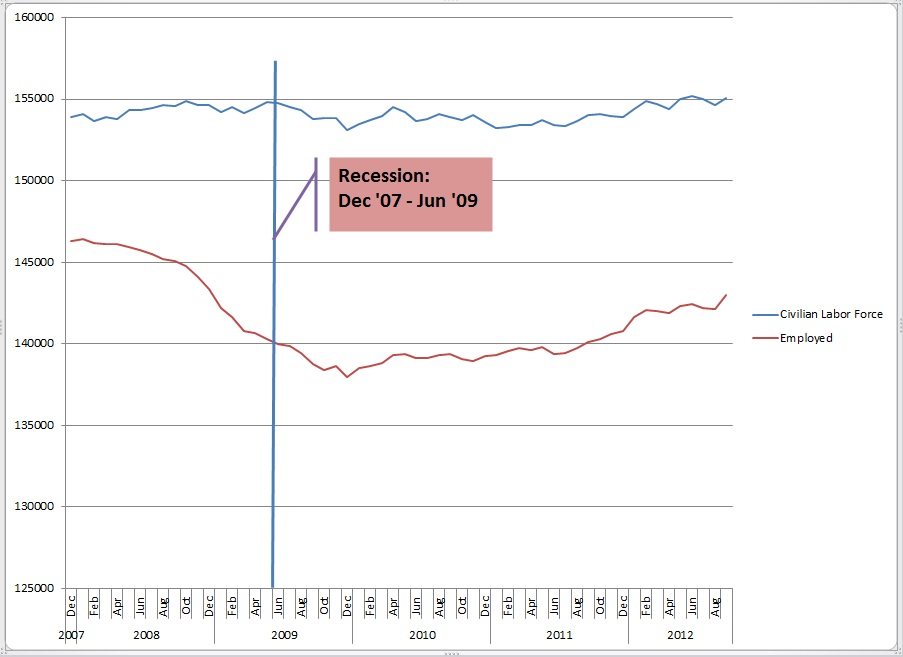
OK, so what does a real economic recovery look like?  Below are graphs showing the size of the civilian labor force and the number of employed people from the official beginning month of the recessions going back to 1973.  The graphs extend out for the first forty months of recovery following the official end of each recession which is where we are with the most recent September 2012 jobs report.

♫ ♪ One of These Things is Not Like the Others… ♪ ♫

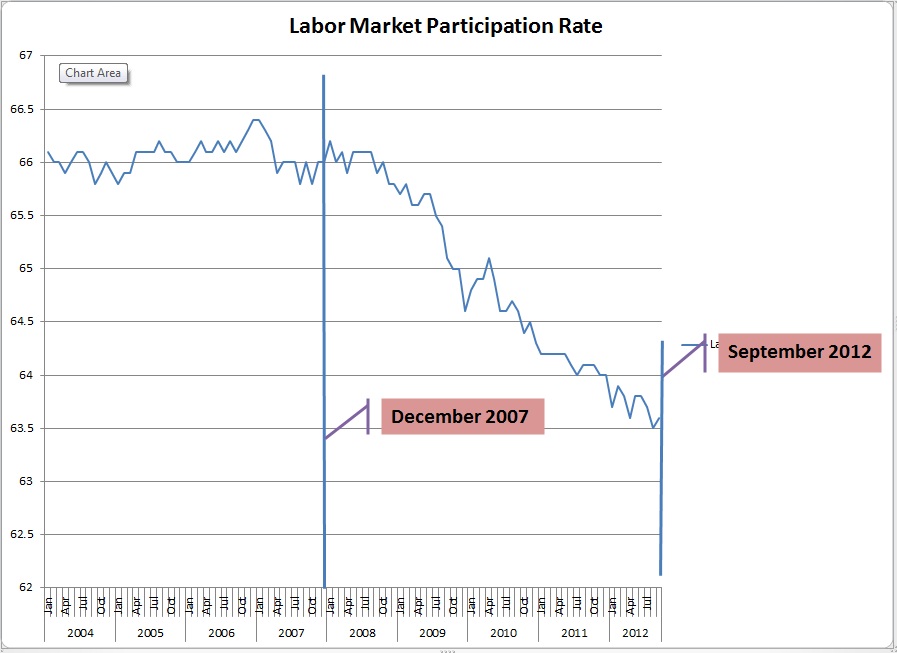
It makes sense for Big Bird to be a media headliner this week because our analysis is no more complicated than applying the Sesame Street Rule; One of These Things is not Like the Others!!  Please note the movement of the labor force size and the number of employed people.  The current “recovery” profile does not resemble any of the past 5 recoveries as the labor force size is flat.  That’s the key to the falling rate.  The final graph shows the participation rate.  As you will see the participation rate had been quite stable for the prior 4 years and then plummeted during the “recovery.”  This validates the graph showing virtually no material movement in the size of the labor force while jobs are added moving the lines closer together.  This gives us a lower unemployment rate even though the labor market is not improved.

All data for the graphs was acquired from the official Bureau of Labor Statistics historical tables which can be found at http://www.bls.gov/cps/cpsatabs.htm


This last graph shows the percentage of prospective workers who are actually participating in the labor market.  This is what is meant when you hear about all the people who have given up and left the labor market.


It’s striking.  Even the recessions that only last a few months demonstrate an increase in labor force size.  It has never been stagnant like it has been for the last forty months!

So, comparing this recession-recovery period with the previous five indicates a dramatic difference between the profiles.

Someone could tell us that this “recovery” is a flute.  If we didn’t know better we might believe it.  We could repeat it.  We could even broadcast it.  But even Big Bird would never be able to blow hard enough to make music with it…because it’s not a flute.

As always, thanks so much for reading.  We hope you enjoyed it and stay tuned…

Every effort is made to ensure accuracy of data transcription but accuracy cannot be guaranteed.  Referenced sources should be reviewed.  Any analysis represents the opinion of Blue World Asset Managers, Ltd. who does not warrant or guarantee predictions based on its analysis.

©Blue World Asset Managers, LTD Friday, October 12, 2012


Blue World Employment Situation Report Analysis 10-05-2012

Release Date:  Usually the first Friday of each month

Release Site: www.bls.gov

Market Sensitivity: VERY HIGH

Management Value: VERY HIGH

Friday, October 05, 2012

Brain surgery is not rocket science to a brain surgeon©

O.K., here we go…

The public markets work on one level and businesses work on another level.  The markets are very reactionary to data points whereas businesses need to pay attention to trends and trends are what give us actionable intelligence.  We hear the cheers coming from the markets this morning because the jobs report was “better” than last month.  That’s not saying much.  As it turns out it was only 7 thousand jobs better which, as you intuitively know, can’t drop the unemployment rate by .3 percent.  But better is better and that’s good enough for the markets.  After all, since when do we cheer 7.8% unemployment over three years into a “recovery?”

Detailed analysis of the report yields far less reason for exuberance.

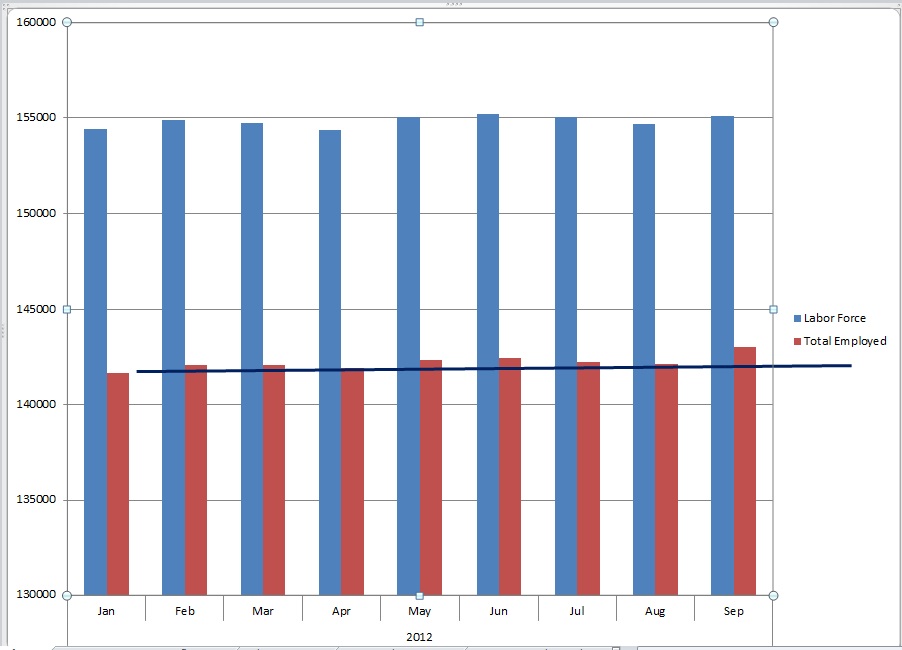
We continue to see the effect of a smaller labor force relative to job gains that bring the unemployment rate down artificially.  We say artificially because we can’t improve the labor market by making it smaller.   These points are validated by the flat employment population ratios and participation rates.

We have demonstrated this phenomenon, graphically, over the course of this year but it has never been as striking as it is for September.  Did the labor market grow in September?  Yes…but it did not even match the high for this year and it grew by a much smaller percentage than the number of jobs.  That, in the land of percentages, could be a good thing so let’s consider the actual numbers.

First, the Revisions

Keep in mind that we need about 250,000 jobs per month just to break even.

We don’t usually focus on revisions but the ones to July and August 2012 were significant and not for the reasons we’d hope.  The labor market is only improving if the private sector is adding jobs, not the government.  That’s because the government’s source of funds to pay government workers come from the private sector.  If the private sector falters, eventually, the government has to lay people off as tax receipts diminish.  July jobs were revised up from 141 thousand to 181 thousand.  The problem is that of the 40 thousand job increase, 18 thousand came from government jobs.  It was even worse in August.  The August 2012 jobs number was revised upward from 96 thousand to 142 thousand.  Of that 46 thousand job increase, 45 thousand came from government.  Government hiring has been on a tear the last three months accounting for over 70 thousand jobs.

For 2012 we are averaging 143 thousand jobs per month and the heft of that average comes from the first quarter.  In 2011 we averaged 153 thousand jobs per month.  Both are well below where we need to be but the trend is what’s important and the trend is negative.  Each month we are flirting with new private jobs at or below 100 thousand.  September payrolls grew by only 114 thousand.  Of that, 10 thousand came from government, leaving the private sector at only 104 thousand new jobs, exceeding August by just 7 thousand jobs.  See why we consider the public markets reactionary?

Here is the chart showing the artificial improvement in the unemployment rate.

                                                                                                                                                                                                                                                                                                                                                                                                             Data Source: www.bls.gov

We saw downward revisions to some previous months’ wages, and some were significant.  Hours worked in construction were disappointing considering all the news we’ve been hearing about housing, lately.  It only matched this year’s February high and still averaging only 38.6 hours per week for the year. Manufacturing hours and overtime are still flat.

The 25+ with a Bachelor’s degree, or higher, are still unemployed at over 4.1% for September.  That of course, remains at rates historically never seen until this recessionary period.

Important sectors losing jobs were not a surprise if we follow the interim Fed reports, GDP, and manufacturing data.  Included were manufacturing, autos and parts, durables, non-durables, information, wholesale trade and private temporary help services.

The diffusion index measures whether industries are adding or losing jobs where a reading of 50 indicates an equal number of industries adding and losing jobs.  The 81 manufacturing industries stand at 39.5 and have trended down all year.

Why the jump in payrolls?  In addition to some meaningful gains in transportation, healthcare and a couple of other private service providing industries, there were significant increases in those taking temporary positions for economic reasons i.e. slack work or the inability to fins full time work.

We would be remiss if we didn’t add this to the mix.  There are shenanigans going on out there.  Earlier this week it was learned that Lockheed Martin, a major employer, was asked to withhold major layoff announcements until after the election.  This is shady enough but based on the WARN act it is reported that the company will be in violation of the law by stalling the announcements.  In exchange for compliance with the White House request the administration has, apparently, agreed to pick up any legal costs and fines.  If this is happening we would be foolish to think it is the only manipulation occurring for political reasons so keep an ear to the ground.  Follow us on Twitter (@BlueWorldMatt) to get timely content.

Corporations are warning, factory orders are falling, manufacturing employment is dwindling, politicians are playing games and the labor market is not improving.  Don’t get caught asleep at the switch.

A shout out to a good friend (Tony) who pointed this out to me; we keep saying “play defense.”  He said “ya always say that but ya never tell us what you recommend for defense if we’re talking about the markets!  Are ya ever gonna?”  Good point!  The answer is “no”, not specifically, anyway.  Whether it’s stop-loss orders, bonds, indexes, options, cash vehicles, long-short or any other safety net you or your advisors employ, make sure they’re ready.  Ride the upside as long as it lasts but keep that safety net moving up underneath you at the same time just in case any of the significant risks out there catch up to the markets.

For business owners, no such vehicles exist.  Watch your costs, be cautious in expansion and remember a cornerstone rule adopted and preached by Blue World:


Profit is Opinion.  Only Cash is Fact.


Thanks for reading and, please, stay tuned…

Release Site: www.bls.gov

Every effort is made to ensure accuracy of data transcription but accuracy cannot be guaranteed.  The official release site should be cross referenced.  The analysis represents the opinion of Blue World Asset Managers, Ltd. who does not warrant or guarantee predictions based on its analysis.

©Blue World Asset Managers, LTD Friday, October 05, 2012

Messin’ with Markets is More Dangerous than Messin’ with Sasquatch!

Thursday, September 13, 2012

Ignorance is curable. Stupid is forever.©

Messin’ with Markets is More Dangerous than Messin’ with Sasquatch!

Time to Roll Up a Newspaper and Smack the Market “Experts” on the Nose!

GDP is below 2%.  Claims for unemployment benefits are up and get revised higher every week.  A record number of Americans are on government assistance.  Social Security and Disability benefits hit record highs with a full month left in the fiscal year. Consumer comfort, confidence and sentiment are low and falling.  Investor confidence is weak.  Manufacturing is contracting.  The Eurozone is on the brink of financial collapse.  Our national debt is over $16 Trillion. Foreclosures are high and rising.  Terrorists are attacking U.S. Embassies around the world and murdering Americans.  And unemployment is over 8%…for over 40 months…yet, somehow, the Dow is up over 200 points on 9/13/2012 because the Fed announced QE3?

It should be of tremendous concern to everyone who has investments in the public markets that market performance has become SO dependent on government action.  Do you realize that the actions contemplated by governments have become more important to the public markets than business fundamentals?  Governments don’t even have to do anything.  All they have to do is hint that they might do something, and the markets go crazy.  It may be a suggestion that the Europeans may bail out Greece, or it may be the U.S. Fed announcing a new round of stimulus, as is the case today.

Let us explain what Quantitative Easing is in simple terms, then decide if you want your investment nest egg tied to more of it.  In its simplest terms it is trading short term debt for long term debt.  It is the proverbial kick-the-can-down-the-road exercise.  The Fed uses our money (tax receipts) to buy back short term bonds (loans to the government) and refinance them for a longer term.  The massive buy-back causes a drop in interest rates that is expected to stimulate the economy.  It is the exact opposite of what they do during boom times when they think the economy is “overheating” and they want to avoid inflation by artificially raising the interest rates to slow things down.

Folks, we’re telling ya, messin’ with markets is more dangerous than messin’ with Sasquatch!  At some point this will have to revert to being about economic fundamentals.  When it does we recommend having the A-Team defense on the field or watch from the stands because it could be a catastrophe.

We can’t understand the exuberance at any level BECAUSE IT DOESN’T WORK, but we would think that the “experts” who get so giddy about such stupid and detrimental policies would have a learning curve that breaks off 180° somewhere.  After all, we have plenty of evidence that these measures don’t work in the face of the current economic environment.  You know what they say about the definition of insanity being the duplication of effort over and over yet expecting different results?  O.K.  the “experts” are not just morons, they’re insane.

For those of you wondering how we can make such assertions regarding the ineffectiveness of prior actions rendering the current ones “insane”…

GDP is below 2%.  Claims for unemployment benefits are up and get revised higher every week.  A record number of Americans are on government assistance.  Social Security and Disability benefits hit record highs with a full month left in the fiscal year. Consumer comfort, confidence and sentiment are low and falling.  Investor confidence is weak.  Manufacturing is contracting.  The Eurozone is on the brink of financial collapse.  Our national debt is over $16 Trillion. Foreclosures are high and rising.  Terrorists are attacking U.S. Embassies around the world and murdering Americans.  And unemployment is over 8%…for over 40 months…


Every effort is made to ensure accuracy of data transcription but accuracy cannot be guaranteed.  Referenced sources should be reviewed.  Any analysis represents the opinion of Blue World Asset Managers, Ltd. who does not warrant or guarantee predictions based on its analysis.

©Blue World Asset Managers, LTD Thursday, September 13, 2012