Blue World Jobs Report Analysis 09-01-2017

Blue World Employment Situation Report Analysis

Release Date: Usually on the first Friday of the month

Release Site: www.bls.gov

Market Impact: Usually Very High

Management Value: Critical

Date Friday, September 01, 2017 

Brain Surgery is not Rocket Science to a Brain Surgeon©


We’ll open today with prayers for all the victims of Harvey. You’re in our thoughts!

Fed Caution                    Fed Caution                      Fed Caution

The more aggressive Fed members were very quick to talk rate hike after the GDP report on Wednesday. We hope this jobs report will ground the hawks, because while this economy is showing real signs of life, it is nowhere near needing a break pumping! A continued belief seems to be that it is inevitable that inflation will show up so these hikes are “prophylactic.” It doesn’t work that way folks, and this jobs report DOES NOT signal inflation is on the way. We’ll explain.

The economy is still fragile and erratic in its growth. There are too many domestic policy  and international uncertainties, reaching levels of downright fear in some cases, like North Korea. Any efforts to keep the economy from “overheating” at this stage are very premature, and the worst thing that could happen for the global economy would be for the U.S. to have to take rates back down. So, Fed, are you listening? Please watch and wait!!

The details are decidedly mixed, and if we had to say lean toward weak, but there are some notable bright spots, too.

On the down side:

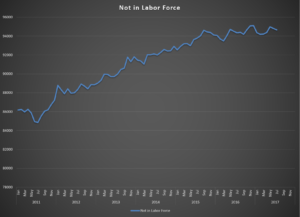
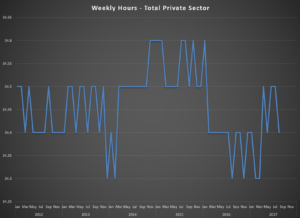
The headline of 156k was a miss on an expectation that just wasn’t very high to begin with (180k). We are being told that wages for the Private Sector only grew .1% month-over-month, but it’s worse than that. The .1% is hourly. Weekly, in other words, salaried workers actually lost ground at -.2%. Weekly Construction lost .1% and Manufacturing lost .6% and a whopping 1% for hourly and weekly employees, respectively so “FED ARE YOU LISTENING? – – NO INFLATION!” The work week remains stubbornly short. Today’s chart is the work week length going back to 2012. The Labor Force grew by 77k, but the Not in Labor Force and Unemployed columns posted triple digit adds. The Participation Rate remains under 63%, and nobody (should care) cares about the Unemployment Rate. To put this into some more perspective, Andre Boucher from Pavilion (www.pavilioncorp.com) sent me a sobering statistic published by Eddy Elfenbein at Crossing Wall Street (www.crossingwallstreet.com). He calculates “In order to have the same jobs-to-population ratio as 17 years ago, we’d need 10.5 million more jobs, or 16.3 million fewer people.” That certainly tells us 156k, 165k, and even 180k per month just won’t get us there.

On the up side:

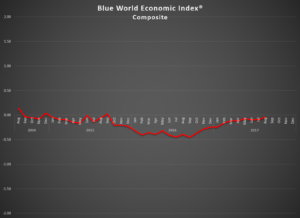
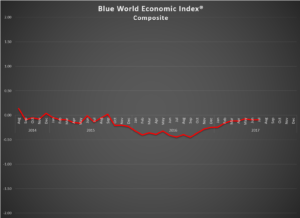
Today’s headline of 156k factored a -9k for Government payrolls leaving the Private Sector tally higher than the headline at 165k. Even though the June and July totals netted out to -41k in revisions, the Private Sector netted +4k, so that is not at all insignificant to the good. The wage disappointment (this is hopeful optimism) may be due, in part, to a temporary dilution effect in Manufacturing and Construction as both sectors made solid gains in payrolls with hefty upward revisions to the previous two months. In fact, the Diffusion Index is at 63.8 for the entire Private Sector and a massive 73.1 for the 78 Manufacturing industries. For comparison, those numbers were 55.7 and 42.3 respectively just one year ago. This validates the Regional Fed surveys regarding strength in Manufacturing hiring and more evidence that anecdotal optimism is starting to enjoy the support of hard data. We talk about that a little more in the Blue World Economic Index® which came out yesterday.

In an unfortunate note, the Fed has abandoned their Labor Market Conditions Index, which followed many of the same key indicators we do and, therefore, tracked very well with our analysis and forecasts. It was one of our favorite internal and external metrics for this analysis as well as a component of the Employment category in the BWEI®. Not to worry, however! We’ll keep doing it for them!!

Thanks for reading, and please stay tuned…

Release Site: www.bls.gov


Every effort is made to ensure accuracy of data transcription but accuracy cannot be guaranteed.  The official release site should be cross referenced. The analysis represents the opinion of Blue World Asset Managers, LTD. who does not warrant or guarantee predictions based on its analysis.


©Blue World Asset Managers, LTD Friday, September 01, 2017


Blue World Economic Index® for August 2017

Brief Explanation

Blue World Economic Index®

Scale: -2 to +2

Release Date:  Usually the Last or First Business Day of Each Month

Release Site: www.blueworldassetmanagers.com

Management Value: Critical

Date 8/31/2017

Analysis

“Objective Signs of Life” is the theme for August 2017, according to the Blue World Economic Index® as we moved a full .05 from -.09 to -.04! After a rather slow start to the month things really started to heat up fast. Inflation and Real Estate were the only real drags on the index for August, especially Housing Starts and Permits, which suffered an oversized and uncomfortable swing from 1 to -.5 on the 16th. That kind of move is rare. Industrial Production ended a streak of positive hard data in Manufacturing, but at least it was the exception not the rule and maybe a blip, as the Philly Fed report is still in high orbit. That brings us the Chicago Fed National Activity Index, which took an unexpected drop considering the strength of every other regional Fed report in the month. Ultimately, four out of six hard data reports in Manufacturing were positive for August so the unbridled optimism of the last nine months may finally be translating to objective improvement. We’ll have to see if it holds.

The Numbers

Five out of the Eight Major Categories remained flat or gained ground including Consumer, Employment, General Measures, Manufacturing and Retail. Employment was the big winner in this group gaining an eye-popping .31. The Retail bump (.29) has to be viewed with some caution as conflicting reports are pulled up by reports that are often contrarian and/or volatile. Inflation and Services lost fractionally, and Real Estate led the decliners by losing a full .2.

Tomorrow is jobs report Friday, and our report is expected out before Noon Eastern. We’ll see you back here at the close of September and hope to report another move to the North.

Have a safe and wonderful Labor Day!


Every effort is made to ensure accuracy of data transcription but accuracy cannot be guaranteed.  The official release sites should be cross referenced.  The index assignments represent the opinion of Blue World Asset Managers, Ltd. who does not warrant or guarantee predictions based on the index.


©Blue World Asset Managers, LTD Thursday, August 31, 2017

Blue World Jobs Report Analysis 8/4/2017

Blue World Employment Situation Report Analysis

Release Date: Usually on the first Friday of the month

Release Site: www.bls.gov

Market Impact: Usually Very High

Management Value: Critical

Friday, August 04, 2017 

Brain Surgery is not Rocket Science to a Brain Surgeon©

GREAT…if it holds…but some WONDERFUL news was hiding in the weeds!

Today’s release provides plenty of reason for OPTIMISM. Are you paying attention, Fed? That is the only downside we can see to this report, the potential overzealousness of the Fed in pursuing another rate hike. Yes, this is a fine report, but it is still in the overwhelming minority of hard data reports hinting at any strength or momentum. Additionally, one report does not a movement make. We need to see this kind of strength sustained and built upon before declaring “improvement.” We can’t just keep sprinkling a good report in here and there with other mediocre to poor reports and be gung ho about raising rates. So, that’s our cautionary note. Now, let’s go enjoy the numbers!

The headline is net 209k, and of those 205k are Private Sector gains. That’s the first time since February that the private sector topped 200k. The Labor Force, Total Employed, and Participation rate were all up. Please continue to be mindful, however, that participation is still below 63%, but let’s not let that be rain on today’s parade. Up is up. The Not in Labor Force tally is down two months in a row and tantalizing us with a suggestion of flattening. That’s the graph this month. Total Unemployed is essentially flat to June. Wages were good for the month, still rather muted for the year, and the work week stayed level.

Revisions essentially netted out, but the big news deeper in hiding was that we just saw our first reliable hint that reality is catching up to sentiment in Manufacturing as we’ve had two big months of gains in a row to coincide with and validate the anecdotal Regional Fed reports in the Blue World Economic Index®. Services were also squarely in the win column for July.

All in all, two decent months in a row where July is a little better than June and this will provide a much needed lift to the Employment category of the Blue World Economic Index® for August, which will post at the end of the month. See you then!


Thanks for reading, and please stay tuned…


Release Site: www.bls.gov

Every effort is made to ensure accuracy of data transcription but accuracy cannot be guaranteed.  The official release site should be cross referenced. The analysis represents the opinion of Blue World Asset Managers, LTD. who does not warrant or guarantee predictions based on its analysis.


©Blue World Asset Managers, LTD Friday, August 04, 2017

Blue World Economic Index® Report for July 2017


Brief Explanation 

Blue World Economic Index®

Scale: -2 to +2

Release Date:  Usually the Last or First Business Day of Each Month

Release Site: www.blueworldassetmanagers.com

Management Value: Critical

Tuesday, August 1, 2017

PODCAST

Analysis

The Blue World Economic Index® for July 2017 was essentially flat for the month showing just a .01 improvement to -.09 from a -.10 in June. Our read is that the economy wants to let loose, but the continued and mounting uncertainty over everything from policy to Putin is just too big an anchor to allow for take off. We were, frankly, surprised that consumer and business optimism continue to hold up so well in the absence of any hard data to support the anecdotal measures, but the momentum slip is palpable. If something tangible doesn’t happen soon, those numbers simply won’t hold. The Fed would do well to react to actual economic data as opposed to anecdotal survey measures and the stock market in considering further rate moves.

The Numbers

Of the eight Major Categories Consumer Measures, Inflation, and Retail pulled back fractionally while Employment, General Measures, Real Estate, and Services made small moves to the North, where General Measures was the only double-digit gainer at .14. Overall Manufacturing was unchanged as the Fed subgroup resumed its climb by .12 to .53 and the Non-fed subgroup lost .03.

We are now evenly split with four Major Categories under water and four in positive territory. Employment, Inflation, Retail, and Services are still sporting red ink while Consumer, General, Manufacturing and Real Estate are positive, all of which made small advances except Consumer Measures which fell a noticeable .07 down to .15

The BLS jobs numbers will be out this Friday the 4th and we will be here in our assigned seats to read, analyze, and report.  See you then.

Every effort is made to ensure accuracy of data transcription but accuracy cannot be guaranteed.  The official release sites should be cross referenced.  The index assignments represent the opinion of Blue World Asset Managers, Ltd. who does not warrant or guarantee predictions based on the index.


©Blue World Asset Managers, LTD Tuesday, August 01, 2017


Blue World Jobs Report Analysis 07/07/2017

Blue World Employment Situation Report Analysis

Release Date: Usually on the first Friday of the month

Release Site: www.bls.gov

Market Impact: Usually Very High

Management Value: Critical

Date Friday, July 7, 2017 

Brain Surgery is not Rocket Science to a Brain Surgeon©

Better, not stellar! June 2017 was a much better month for jobs than May, but that’s a pretty low bar. As Matt said on CBS Chicago last Monday, you could have knocked us over with a feather at the rate raise. Last month’s jobs report fed the doves, and we saw no chance of a hike. We were dying to see the minutes so we’d get a hint of what they saw that we didn’t. The answer is “nothing.” This raise was all on spec and what they “think” will happen with inflation considering the “strengthening” in the job market so, clearly, the consumer will start spending soon and inflation will, ya know, show up. Evidence schmevidence!

So, what about today? At the headline we saw 222k net new hires less the 35k added to government payrolls, the private sector logged 187k net new jobs. Better? Sure, but it’s kinda like a pro golfer shooting par on a par 5 under 500 yards. In other words, no damage done and yet disappointing. There were solid improvements in the key indicators we follow like the Civilian Labor Force size, Total Employed, and the Participation Rate. There was also a decrease in the Not in Labor Force number, which has remained below 95M for the year.

BUT…

The Participation Rate remains below 63% (It was 64%+ back in 2011, and we were horrified then!) While the Not in Labor Force numbers do appear to have leveled off, the chart has not started a down trend yet, and that is what makes characterizations of “full employment” ludicrous. When looking at the U-6 line of Table A-15 of the report that takes those and several other labor underutilization stats into account, the true unemployment rate is still 9%.

Weekly hours and wages also showed some life, and the workweek has now touched 34.5 hours twice in three months. It’s been a while since we’ve seen that. Hourly and Weekly wages posted 2.5% and 2.8% year-on-year gains, respectively.

Better? Yes. Stellar? No. Good enough for a rate hike? NO! The hard data to support it just isn’t there. Have a look at the Blue World Economic Index® for more detail June’s economic reporting.

We hope 4th of July was fun and safe. See you back here in August.

As always, thanks for reading, and please stay tuned…

Release Site: www.bls.gov

Every effort is made to ensure accuracy of data transcription but accuracy cannot be guaranteed.  The official release site should be cross referenced. The analysis represents the opinion of Blue World Asset Managers, LTD. who does not warrant or guarantee predictions based on its analysis.
 
©Blue World Asset Managers, LTD Friday, July 07, 2017