Blue World Economic Index® Report 10/03/2017


Brief Explanation

Blue World Economic Index®

Scale: -2 to +2

Release Date:  Usually the Last or First Business Day of Each Month

Release Site: www.blueworldassetmanagers.com

Management Value: Critical

Date October 3, 2017

Analysis

The economy’s flirtation with a positive reading is as tantalizing as a butter-seared, blood-rare Porterhouse, wild rice and a snifter of cognac is to me on a Saturday night! TMI? Apologies.

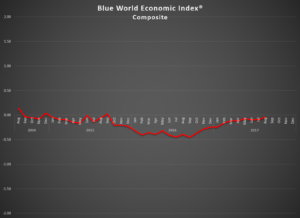
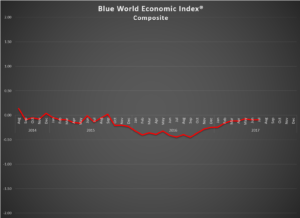
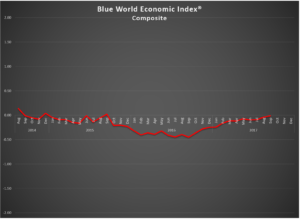
The Blue World Economic Index® made a solid move from -.4 to -.1 for the month of September 2017. It must be noted that looking at a lot of the reports would suggest bigger changes from last month in either direction, but we exercised a bit more restraint due to the awareness of the continued but temporary impact of the active hurricane season. There was also a material impact from short and long-term trend upgrades in GDP from -1 to -.5 because the trends are weighted more heavily than the current month’s report.

That said, we expected worse from the hurricanes, especially in reports that post in the second half of the month, and the consumer appears to have already gotten over it. Below we’ll talk about weakness in Real Estate, but there is a lot of thinking out there that the weakness represents a short-term rebalancing and may be a harbinger of better things to come later next year. The Chicago Fed has been the only contrarian in the Fed sub-group two months in a row, which is a bit perplexing and concerning since that report is uniquely national in scope rather than regional like the others we follow for that group, and the regionals are knocking the cover off the ball.

December Fed meeting, you ask? The late entries of Personal Income and Outlays, Farm Prices, and GDP Inflation coupled with the mid-month reports of Producer Price Index-Final Demand and the Consumer Price Index all suggest inflation still resides in the where-are-they-now-file, but there are, as we’ve said, some other positives. We think there are arguments for the doves and hawks, but we are taking the under this month and saying we’ve seen the last of the hikes for 2017. 

The Numbers

Of the eight major categories, five are still above water. They are Consumer, General, Manufacturing, Real Estate, and Retail. Of those, all but one, Real Estate, posted gains since last month, but recall some of the conflicting signals in Retail where negative scores for Motor Vehicle Sales and Retail Sales were cancelled out by equal and opposite scores in Business Inventories and E-Retail, leaving the notoriously contrarian Red Book report to carry the ball. Manufacturing continues to excite with the Fed AND non-Fed groups advancing .03. Employment and Inflation are still underwater, where Employment slipped fractionally, but Inflation, while improved .11, is still solidly negative at -.37. Services remained unchanged at -.16.

We’ll see what else the hurricanes have to offer the fourth quarter, and with high stakes policy issues like tax reform coming up we see volatility and excitement from street level to Wall Street on tap!

The Blue World Jobs Report Analysis will post on Friday. Have a great October, a wonderful Halloween and we’ll see you back here at the opening of November.

Every effort is made to ensure accuracy of data transcription but accuracy cannot be guaranteed.  The official release sites should be cross referenced.  The index assignments represent the opinion of Blue World Asset Managers, Ltd. who does not warrant or guarantee predictions based on the index.
©Blue World Asset Managers, LTD Tuesday, October 03, 2017

Blue World Economic Index® for August 2017

Brief Explanation

Blue World Economic Index®

Scale: -2 to +2

Release Date:  Usually the Last or First Business Day of Each Month

Release Site: www.blueworldassetmanagers.com

Management Value: Critical

Date 8/31/2017

Analysis

“Objective Signs of Life” is the theme for August 2017, according to the Blue World Economic Index® as we moved a full .05 from -.09 to -.04! After a rather slow start to the month things really started to heat up fast. Inflation and Real Estate were the only real drags on the index for August, especially Housing Starts and Permits, which suffered an oversized and uncomfortable swing from 1 to -.5 on the 16th. That kind of move is rare. Industrial Production ended a streak of positive hard data in Manufacturing, but at least it was the exception not the rule and maybe a blip, as the Philly Fed report is still in high orbit. That brings us the Chicago Fed National Activity Index, which took an unexpected drop considering the strength of every other regional Fed report in the month. Ultimately, four out of six hard data reports in Manufacturing were positive for August so the unbridled optimism of the last nine months may finally be translating to objective improvement. We’ll have to see if it holds.

The Numbers

Five out of the Eight Major Categories remained flat or gained ground including Consumer, Employment, General Measures, Manufacturing and Retail. Employment was the big winner in this group gaining an eye-popping .31. The Retail bump (.29) has to be viewed with some caution as conflicting reports are pulled up by reports that are often contrarian and/or volatile. Inflation and Services lost fractionally, and Real Estate led the decliners by losing a full .2.

Tomorrow is jobs report Friday, and our report is expected out before Noon Eastern. We’ll see you back here at the close of September and hope to report another move to the North.

Have a safe and wonderful Labor Day!


Every effort is made to ensure accuracy of data transcription but accuracy cannot be guaranteed.  The official release sites should be cross referenced.  The index assignments represent the opinion of Blue World Asset Managers, Ltd. who does not warrant or guarantee predictions based on the index.


©Blue World Asset Managers, LTD Thursday, August 31, 2017

Blue World Jobs Report Analysis 8/4/2017

Blue World Employment Situation Report Analysis

Release Date: Usually on the first Friday of the month

Release Site: www.bls.gov

Market Impact: Usually Very High

Management Value: Critical

Friday, August 04, 2017 

Brain Surgery is not Rocket Science to a Brain Surgeon©

GREAT…if it holds…but some WONDERFUL news was hiding in the weeds!

Today’s release provides plenty of reason for OPTIMISM. Are you paying attention, Fed? That is the only downside we can see to this report, the potential overzealousness of the Fed in pursuing another rate hike. Yes, this is a fine report, but it is still in the overwhelming minority of hard data reports hinting at any strength or momentum. Additionally, one report does not a movement make. We need to see this kind of strength sustained and built upon before declaring “improvement.” We can’t just keep sprinkling a good report in here and there with other mediocre to poor reports and be gung ho about raising rates. So, that’s our cautionary note. Now, let’s go enjoy the numbers!

The headline is net 209k, and of those 205k are Private Sector gains. That’s the first time since February that the private sector topped 200k. The Labor Force, Total Employed, and Participation rate were all up. Please continue to be mindful, however, that participation is still below 63%, but let’s not let that be rain on today’s parade. Up is up. The Not in Labor Force tally is down two months in a row and tantalizing us with a suggestion of flattening. That’s the graph this month. Total Unemployed is essentially flat to June. Wages were good for the month, still rather muted for the year, and the work week stayed level.

Revisions essentially netted out, but the big news deeper in hiding was that we just saw our first reliable hint that reality is catching up to sentiment in Manufacturing as we’ve had two big months of gains in a row to coincide with and validate the anecdotal Regional Fed reports in the Blue World Economic Index®. Services were also squarely in the win column for July.

All in all, two decent months in a row where July is a little better than June and this will provide a much needed lift to the Employment category of the Blue World Economic Index® for August, which will post at the end of the month. See you then!


Thanks for reading, and please stay tuned…


Release Site: www.bls.gov

Every effort is made to ensure accuracy of data transcription but accuracy cannot be guaranteed.  The official release site should be cross referenced. The analysis represents the opinion of Blue World Asset Managers, LTD. who does not warrant or guarantee predictions based on its analysis.


©Blue World Asset Managers, LTD Friday, August 04, 2017

Blue World Economic Index® Report for July 2017


Brief Explanation 

Blue World Economic Index®

Scale: -2 to +2

Release Date:  Usually the Last or First Business Day of Each Month

Release Site: www.blueworldassetmanagers.com

Management Value: Critical

Tuesday, August 1, 2017

PODCAST

Analysis

The Blue World Economic Index® for July 2017 was essentially flat for the month showing just a .01 improvement to -.09 from a -.10 in June. Our read is that the economy wants to let loose, but the continued and mounting uncertainty over everything from policy to Putin is just too big an anchor to allow for take off. We were, frankly, surprised that consumer and business optimism continue to hold up so well in the absence of any hard data to support the anecdotal measures, but the momentum slip is palpable. If something tangible doesn’t happen soon, those numbers simply won’t hold. The Fed would do well to react to actual economic data as opposed to anecdotal survey measures and the stock market in considering further rate moves.

The Numbers

Of the eight Major Categories Consumer Measures, Inflation, and Retail pulled back fractionally while Employment, General Measures, Real Estate, and Services made small moves to the North, where General Measures was the only double-digit gainer at .14. Overall Manufacturing was unchanged as the Fed subgroup resumed its climb by .12 to .53 and the Non-fed subgroup lost .03.

We are now evenly split with four Major Categories under water and four in positive territory. Employment, Inflation, Retail, and Services are still sporting red ink while Consumer, General, Manufacturing and Real Estate are positive, all of which made small advances except Consumer Measures which fell a noticeable .07 down to .15

The BLS jobs numbers will be out this Friday the 4th and we will be here in our assigned seats to read, analyze, and report.  See you then.

Every effort is made to ensure accuracy of data transcription but accuracy cannot be guaranteed.  The official release sites should be cross referenced.  The index assignments represent the opinion of Blue World Asset Managers, Ltd. who does not warrant or guarantee predictions based on the index.


©Blue World Asset Managers, LTD Tuesday, August 01, 2017


Blue World Economic Index® for June 2017

Blue World Economic Index®

Scale: -2 to +2

Release Date:  Usually the Last or First Business Day of Each Month

Release Site: www.blueworldassetmanagers.com

Management Value: Critical

Release Site: www.blueworldassetmanagers.com

Brief Explanation

Date: Friday, July 7, 2017

Brain Surgery is not Rocket Science to a Brain Surgeon©

Rate hike? REALLY?

Wow, we’ve seen some speculative moves in our day, but this one is worthy of commodity speculators!! We thought either we missed something or they are betting the come. Of course, we know it’s not the former! The notes essentially confirm their decision is based on what they think will happen as opposed to what is happening. Most notably, they think with the Labor Market “strengthening” consumers will start spending soon and that coupled with wage acceleration will drive inflation. Those are some high odds bets considering nine years of flat “expansion.” Gotta love dem “experts! ”

Let’s look at what’s really happening. The BWEI® Composite pulled back from -07 to an even -.1. Deterioration was led by Employment (-.21) and Inflation (-.14) GOTTA LOVE DEM EXPERTS!! (Apologies for the outburst…) There were fractional declines in Consumer Measures and Real Estate with Manufacturing holding unchanged at the Category Composite and Fed sub-group. Minor gains were seen in General Measures and Retail, although the retail improvement was led by the Red Book weekly report which is notoriously contrarian with other retail metrics. The most substantial move to the upside was Services at a .11 pickup.

Rate hike? We think it a seriously big bet, especially as the talk of recession and market meltdowns is being broadcast from Marshall stacks.

We’ll see!

Matt will be on WBBM in Chicago to talk about the June jobs report at 12:09C. The report is up here.

Have a great month and we’ll meet back here in August 2017.


Every effort is made to ensure accuracy of data transcription but accuracy cannot be guaranteed.  The official release sites should be cross referenced.  The index assignments represent the opinion of Blue World Asset Managers, Ltd. who does not warrant or guarantee predictions based on the index.


©Blue World Asset Managers, LTD Friday, 7/7/2017