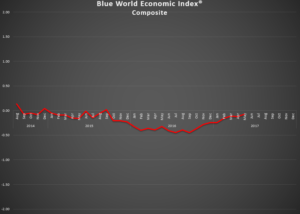
Blue World Economic Index®
Scale: -2 to +2
Release Date: Usually the Last or First Business Day of Each Month
Release Site: www.blueworldassetmanagers.com
Management Value: Critical
Release Site: www.blueworldassetmanagers.com
Date: Friday, July 7, 2017
Brain Surgery is not Rocket Science to a Brain Surgeon©
Rate hike? REALLY?
Wow, we’ve seen some speculative moves in our day, but this one is worthy of commodity speculators!! We thought either we missed something or they are betting the come. Of course, we know it’s not the former! The notes essentially confirm their decision is based on what they think will happen as opposed to what is happening. Most notably, they think with the Labor Market “strengthening” consumers will start spending soon and that coupled with wage acceleration will drive inflation. Those are some high odds bets considering nine years of flat “expansion.” Gotta love dem “experts! ”
Let’s look at what’s really happening. The BWEI® Composite pulled back from -07 to an even -.1. Deterioration was led by Employment (-.21) and Inflation (-.14) GOTTA LOVE DEM EXPERTS!! (Apologies for the outburst…) There were fractional declines in Consumer Measures and Real Estate with Manufacturing holding unchanged at the Category Composite and Fed sub-group. Minor gains were seen in General Measures and Retail, although the retail improvement was led by the Red Book weekly report which is notoriously contrarian with other retail metrics. The most substantial move to the upside was Services at a .11 pickup.
Rate hike? We think it a seriously big bet, especially as the talk of recession and market meltdowns is being broadcast from Marshall stacks.
We’ll see!
Matt will be on WBBM in Chicago to talk about the June jobs report at 12:09C. The report is up here.
Have a great month and we’ll meet back here in August 2017.
Every effort is made to ensure accuracy of data transcription but accuracy cannot be guaranteed. The official release sites should be cross referenced. The index assignments represent the opinion of Blue World Asset Managers, Ltd. who does not warrant or guarantee predictions based on the index.