Blue World Economic Index® for October 2017

Brief Explanation 

Blue World Economic Index®

Scale: -2 to +2

Release Date:  Usually the Last or First Business Day of Each Month

Release Site: www.blueworldassetmanagers.com

Management Value: Critical

Date Thursday November 2, 2017


Analysis

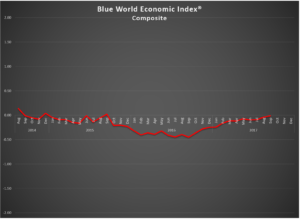
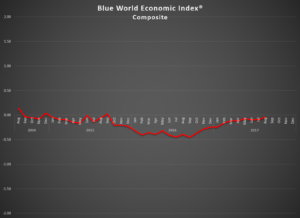
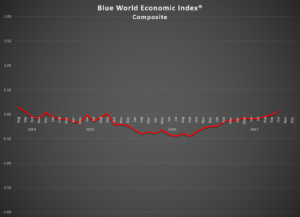
Happy Halloween! If you’re looking for a scare, the economy isn’t going to provide it. The Blue World Economic Index® broke into positive territory for the first time since September 2015 and is at the second highest level since the report has been published! We’re not saying were high enough above water for a human to both see and breath, but an alligator could. The analysis section will cover a bit more than usual in terms of individual reports.

Again, we see the move driven by some trends that demanded upgrades and a whole lot of anecdotal optimism measures, but that is not to say the hard data is still missing. The hurricanes had a small but seemingly very temporary effect. The Durable Goods report was strong and added more support to the regional Fed reports which, by the way, are so high they can probably be viewed at eye-level from the International Space Station! Regulations have been quietly rolled back in waves, and the prospect of a tax cut is still in play. The uncertainty surrounding investigations, indictments, nuclear war, etc. are all still serious risks to the optimism-fueled surge, but the momentum has proven quite resilient so far.

The FHFA House Price Index came in high and is what drove the BWEI® into positive territory late in the month (25th) and it never looked back. We’ve seen some intra-month positives on occasion, but they’ve never held.

Manufacturing is still growing and now both by survey and hard data. Empire State and Philly Fed earned very unusual 2’s for the month for blowing both last month and estimates out of the water. The Kansas City Fed and Sub-Fed composite hit new highs and hurricanes were not even a speed bump for the Dallas Fed region still being led by new orders and a Capacity Utilization at 10 year highs. The only downer in manufacturing all month was the Industrial Production Report.

GDP from last Friday was the second 3% reading in a row, but we need to see how artificial the inventories contribution was as a result of hurricanes; however, it was still enough to earn a short-term trend upgrade. Personal Income and Outlays was solid but for the inflation component although vehicle replacement after hurricanes helped so that will have to be monitored. 

The Numbers

Five of the eight major categories are now in positive territory including Consumer, General, Manufacturing, Real Estate and Retail, with Employment, Services, and Inflation still posting in red ink.  All but Employment, however, showed improvement over the course of October 2017. Employment is no surprise considering the abysmal showing last month which we hope to correct on Friday.

We hope to see you Friday morning for the Blue World Jobs Report Analysis. Until then, HAPPY HALLOWEEN and HAPPY THANKSGIVING. See you on or about December 1st as we hit the home stretch of 2017!


Every effort is made to ensure accuracy of data transcription but accuracy cannot be guaranteed.  The official release sites should be cross referenced.  The index assignments represent the opinion of Blue World Asset Managers, Ltd. who does not warrant or guarantee predictions based on the index.


©Blue World Asset Managers, LTD Thursday, November 02, 2017

Blue World Jobs Report Analysis October 6, 2017


Blue World Employment Situation Report Analysis

Release Date: Usually on the first Friday of the month

Release Site: www.bls.gov

Market Impact: Usually Very High

Management Value: Critical

Date: October 6, 2017 

Brain Surgery is not Rocket Science to a Brain Surgeon©

Should we panic? Perhaps…but not because of this jobs report. Today was a fascinating exercise in data collection and analysis. There is absolutely no reason to go into most of the actual numbers this month, but we have to go through the positives and negatives because, taken at face value, this report is awesome! In fact, if we were to be given the detail in advance and asked to predict job growth based on them, we’d have projected between 200k and 225k.

The Labor Force, Total Employed, Participation Rate, and Employed-Population Ratio all grew by very healthy margins. The Unemployment Rate, Total Unemployed, and Not in Labor Force totals all fell…by very healthy margins! The bad news was all in the headlines. Is there an explanation? Yup.

The obvious answer is the active hurricane season. But how does that throw this report into chaos? One example, without going too deep into the weeds, the report data is acquired from two different surveys, Household, which surveys individuals, and Establishment, which surveys employers. This is an unusual circumstance in that one who is counted as employed by one survey is counted as unemployed in the other based on whether they got paid. As we might suspect, the hospitality industry took it on the chin, so a lot of folks with “jobs” didn’t end up working and didn’t get “paid.” A major data point we were waiting to see was the response rate. We can get significant revisions to the jobs report over the two months following each release as many send their survey responses late. This month we fully expected the timely response rate to be way down. It wasn’t. According to the BLS, response rates were within normal limits in and out of the hurricane affected regions.

So…pay no attention to the details behind the curtain EXCEPT the revisions. The only meaningful data point to come out of this report is the net -38k revisions to July and August. That brings the three-month headline down to a 91k average for Q3 2017. That is simply not good enough.

At writing, S&P futures are trending down, but there is no indication of a gap-down vertical graph, so it seems the markets will take this in stride understanding the temporary nature of a report that will undoubtedly revise between now and year end.

For more on the overall state of the economy you’re invited to review the Blue World Economic Index® Report for September which posted earlier this week. We’ll have no choice but to downgrade the index value for this report under the Employment category, but it won’t be as severe as the numbers imply for all the anomalous reasons listed above.

Have a great and safe Halloween, and we’ll meet back here for the next Employment Situation release, which is scheduled for Friday, November 3.

Thanks for reading, and please stay tuned…

Release Site: www.bls.gov

Every effort is made to ensure accuracy of data transcription but accuracy cannot be guaranteed.  The official release site should be cross referenced. The analysis represents the opinion of Blue World Asset Managers, LTD. who does not warrant or guarantee predictions based on its analysis.


©Blue World Asset Managers, LTD Friday, October 06, 2017

Blue World Economic Index® Report 10/03/2017


Brief Explanation

Blue World Economic Index®

Scale: -2 to +2

Release Date:  Usually the Last or First Business Day of Each Month

Release Site: www.blueworldassetmanagers.com

Management Value: Critical

Date October 3, 2017

Analysis

The economy’s flirtation with a positive reading is as tantalizing as a butter-seared, blood-rare Porterhouse, wild rice and a snifter of cognac is to me on a Saturday night! TMI? Apologies.

The Blue World Economic Index® made a solid move from -.4 to -.1 for the month of September 2017. It must be noted that looking at a lot of the reports would suggest bigger changes from last month in either direction, but we exercised a bit more restraint due to the awareness of the continued but temporary impact of the active hurricane season. There was also a material impact from short and long-term trend upgrades in GDP from -1 to -.5 because the trends are weighted more heavily than the current month’s report.

That said, we expected worse from the hurricanes, especially in reports that post in the second half of the month, and the consumer appears to have already gotten over it. Below we’ll talk about weakness in Real Estate, but there is a lot of thinking out there that the weakness represents a short-term rebalancing and may be a harbinger of better things to come later next year. The Chicago Fed has been the only contrarian in the Fed sub-group two months in a row, which is a bit perplexing and concerning since that report is uniquely national in scope rather than regional like the others we follow for that group, and the regionals are knocking the cover off the ball.

December Fed meeting, you ask? The late entries of Personal Income and Outlays, Farm Prices, and GDP Inflation coupled with the mid-month reports of Producer Price Index-Final Demand and the Consumer Price Index all suggest inflation still resides in the where-are-they-now-file, but there are, as we’ve said, some other positives. We think there are arguments for the doves and hawks, but we are taking the under this month and saying we’ve seen the last of the hikes for 2017. 

The Numbers

Of the eight major categories, five are still above water. They are Consumer, General, Manufacturing, Real Estate, and Retail. Of those, all but one, Real Estate, posted gains since last month, but recall some of the conflicting signals in Retail where negative scores for Motor Vehicle Sales and Retail Sales were cancelled out by equal and opposite scores in Business Inventories and E-Retail, leaving the notoriously contrarian Red Book report to carry the ball. Manufacturing continues to excite with the Fed AND non-Fed groups advancing .03. Employment and Inflation are still underwater, where Employment slipped fractionally, but Inflation, while improved .11, is still solidly negative at -.37. Services remained unchanged at -.16.

We’ll see what else the hurricanes have to offer the fourth quarter, and with high stakes policy issues like tax reform coming up we see volatility and excitement from street level to Wall Street on tap!

The Blue World Jobs Report Analysis will post on Friday. Have a great October, a wonderful Halloween and we’ll see you back here at the opening of November.

Every effort is made to ensure accuracy of data transcription but accuracy cannot be guaranteed.  The official release sites should be cross referenced.  The index assignments represent the opinion of Blue World Asset Managers, Ltd. who does not warrant or guarantee predictions based on the index.
©Blue World Asset Managers, LTD Tuesday, October 03, 2017

Blue World Economic Index® for August 2017

Brief Explanation

Blue World Economic Index®

Scale: -2 to +2

Release Date:  Usually the Last or First Business Day of Each Month

Release Site: www.blueworldassetmanagers.com

Management Value: Critical

Date 8/31/2017

Analysis

“Objective Signs of Life” is the theme for August 2017, according to the Blue World Economic Index® as we moved a full .05 from -.09 to -.04! After a rather slow start to the month things really started to heat up fast. Inflation and Real Estate were the only real drags on the index for August, especially Housing Starts and Permits, which suffered an oversized and uncomfortable swing from 1 to -.5 on the 16th. That kind of move is rare. Industrial Production ended a streak of positive hard data in Manufacturing, but at least it was the exception not the rule and maybe a blip, as the Philly Fed report is still in high orbit. That brings us the Chicago Fed National Activity Index, which took an unexpected drop considering the strength of every other regional Fed report in the month. Ultimately, four out of six hard data reports in Manufacturing were positive for August so the unbridled optimism of the last nine months may finally be translating to objective improvement. We’ll have to see if it holds.

The Numbers

Five out of the Eight Major Categories remained flat or gained ground including Consumer, Employment, General Measures, Manufacturing and Retail. Employment was the big winner in this group gaining an eye-popping .31. The Retail bump (.29) has to be viewed with some caution as conflicting reports are pulled up by reports that are often contrarian and/or volatile. Inflation and Services lost fractionally, and Real Estate led the decliners by losing a full .2.

Tomorrow is jobs report Friday, and our report is expected out before Noon Eastern. We’ll see you back here at the close of September and hope to report another move to the North.

Have a safe and wonderful Labor Day!


Every effort is made to ensure accuracy of data transcription but accuracy cannot be guaranteed.  The official release sites should be cross referenced.  The index assignments represent the opinion of Blue World Asset Managers, Ltd. who does not warrant or guarantee predictions based on the index.


©Blue World Asset Managers, LTD Thursday, August 31, 2017

Blue World Jobs Report Analysis 8/4/2017

Blue World Employment Situation Report Analysis

Release Date: Usually on the first Friday of the month

Release Site: www.bls.gov

Market Impact: Usually Very High

Management Value: Critical

Friday, August 04, 2017 

Brain Surgery is not Rocket Science to a Brain Surgeon©

GREAT…if it holds…but some WONDERFUL news was hiding in the weeds!

Today’s release provides plenty of reason for OPTIMISM. Are you paying attention, Fed? That is the only downside we can see to this report, the potential overzealousness of the Fed in pursuing another rate hike. Yes, this is a fine report, but it is still in the overwhelming minority of hard data reports hinting at any strength or momentum. Additionally, one report does not a movement make. We need to see this kind of strength sustained and built upon before declaring “improvement.” We can’t just keep sprinkling a good report in here and there with other mediocre to poor reports and be gung ho about raising rates. So, that’s our cautionary note. Now, let’s go enjoy the numbers!

The headline is net 209k, and of those 205k are Private Sector gains. That’s the first time since February that the private sector topped 200k. The Labor Force, Total Employed, and Participation rate were all up. Please continue to be mindful, however, that participation is still below 63%, but let’s not let that be rain on today’s parade. Up is up. The Not in Labor Force tally is down two months in a row and tantalizing us with a suggestion of flattening. That’s the graph this month. Total Unemployed is essentially flat to June. Wages were good for the month, still rather muted for the year, and the work week stayed level.

Revisions essentially netted out, but the big news deeper in hiding was that we just saw our first reliable hint that reality is catching up to sentiment in Manufacturing as we’ve had two big months of gains in a row to coincide with and validate the anecdotal Regional Fed reports in the Blue World Economic Index®. Services were also squarely in the win column for July.

All in all, two decent months in a row where July is a little better than June and this will provide a much needed lift to the Employment category of the Blue World Economic Index® for August, which will post at the end of the month. See you then!


Thanks for reading, and please stay tuned…


Release Site: www.bls.gov

Every effort is made to ensure accuracy of data transcription but accuracy cannot be guaranteed.  The official release site should be cross referenced. The analysis represents the opinion of Blue World Asset Managers, LTD. who does not warrant or guarantee predictions based on its analysis.


©Blue World Asset Managers, LTD Friday, August 04, 2017